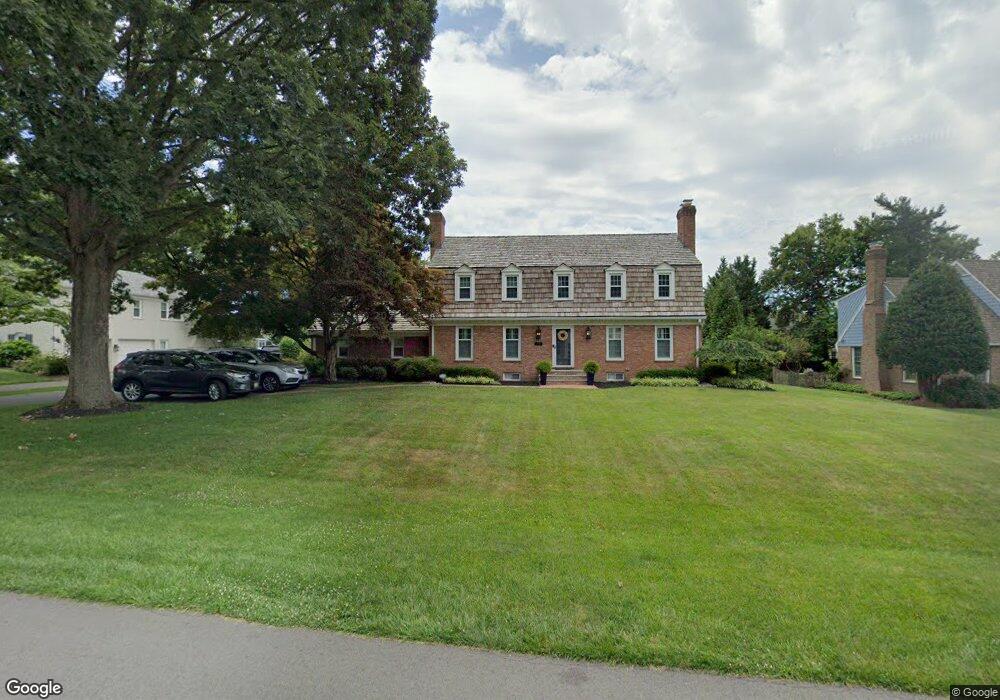
15421 Quail Run Dr Gaithersburg, MD 20878
Estimated Value: $926,000 - $1,052,000
--
Bed
3
Baths
2,911
Sq Ft
$341/Sq Ft
Est. Value
About This Home
This home is located at 15421 Quail Run Dr, Gaithersburg, MD 20878 and is currently estimated at $991,481, approximately $340 per square foot. 15421 Quail Run Dr is a home located in Montgomery County with nearby schools including Jones Lane Elementary School, Leslie Middle School, and Madison Middle School.
Ownership History
Date
Name
Owned For
Owner Type
Purchase Details
Closed on
Feb 18, 2024
Sold by
Tyree Carl E and Tyree Kelly Nelson
Bought by
Carl E Tyree Revocable Trust and Kelly N Tyree Revocable Trust
Current Estimated Value
Purchase Details
Closed on
Mar 17, 2014
Sold by
Jorgensen Eric E
Bought by
Tyree Carl E and Tyree Kelly Nelson
Home Financials for this Owner
Home Financials are based on the most recent Mortgage that was taken out on this home.
Original Mortgage
$573,660
Interest Rate
4.27%
Mortgage Type
New Conventional
Purchase Details
Closed on
Feb 7, 2013
Sold by
Jackson Mary Beth and Stefanelli Richard F
Bought by
Jorgensen Eric E
Purchase Details
Closed on
Sep 25, 2006
Sold by
Jorgensen Bettie A
Bought by
Jorgensen Bettie A
Purchase Details
Closed on
Sep 22, 2006
Sold by
Jorgensen Bettie A
Bought by
Jorgensen Bettie A
Create a Home Valuation Report for This Property
The Home Valuation Report is an in-depth analysis detailing your home's value as well as a comparison with similar homes in the area
Home Values in the Area
Average Home Value in this Area
Purchase History
| Date | Buyer | Sale Price | Title Company |
|---|---|---|---|
| Carl E Tyree Revocable Trust | -- | None Listed On Document | |
| Carl E Tyree Revocable Trust | -- | None Listed On Document | |
| Tyree Carl E | $637,400 | Fidelity Natl Title Ins Co | |
| Jorgensen Eric E | -- | None Available | |
| Jorgensen Bettie A | -- | -- | |
| Jorgensen Bettie A | -- | -- |
Source: Public Records
Mortgage History
| Date | Status | Borrower | Loan Amount |
|---|---|---|---|
| Previous Owner | Tyree Carl E | $573,660 |
Source: Public Records
Tax History Compared to Growth
Tax History
| Year | Tax Paid | Tax Assessment Tax Assessment Total Assessment is a certain percentage of the fair market value that is determined by local assessors to be the total taxable value of land and additions on the property. | Land | Improvement |
|---|---|---|---|---|
| 2025 | $9,344 | $844,933 | -- | -- |
| 2024 | $9,344 | $766,900 | $249,800 | $517,100 |
| 2023 | $8,200 | $729,867 | $0 | $0 |
| 2022 | $7,421 | $692,833 | $0 | $0 |
| 2021 | $6,541 | $655,800 | $238,000 | $417,800 |
| 2020 | $6,541 | $620,800 | $0 | $0 |
| 2019 | $6,137 | $585,800 | $0 | $0 |
| 2018 | $5,754 | $550,800 | $238,000 | $312,800 |
| 2017 | $5,569 | $524,467 | $0 | $0 |
| 2016 | $5,540 | $498,133 | $0 | $0 |
| 2015 | $5,540 | $471,800 | $0 | $0 |
| 2014 | $5,540 | $471,800 | $0 | $0 |
Source: Public Records
Map
Nearby Homes
- 15613 Ancient Oak Dr
- Millie Plan at Quail Run Landing - Estates at Quail Run
- Chito Plan at Quail Run Landing - Estates at Quail Run
- Chandler Plan at Quail Run Landing - Estates at Quail Run
- 12907 Quail Run Ct
- 12902 Quail Run Ct
- 12827 Tern Dr
- 15205 Quail Run Dr
- 55 Gravenhurst Ct
- 12505 Fellowship Ln
- 13300 Wye Oak Dr
- 12709 War Admiral Way
- 12233 Quince Valley Dr
- 12307 Sweetbough Ct
- 0 Darnestown Rd
- 15428 Peach Leaf Dr
- 12409 Keeneland Place
- 115 Johnson Meadow St
- 13000 Brandon Way Rd
- 5 Winesap Ct
- 15417 Quail Run Dr
- 15425 Quail Run Dr
- 15415 Quail Run Dr
- 15220 Buckeye Ct
- 15429 Quail Run Dr
- 15420 Quail Run Dr
- 15424 Quail Run Dr
- 15408 Jones Ln
- 15416 Quail Run Dr
- 15409 Quail Run Dr
- 15428 Quail Run Dr
- 15219 Buckeye Ct
- 15404 Jones Ln
- 15412 Quail Run Dr
- 15432 Quail Run Dr
- 15216 Buckeye Ct
- 15405 Quail Run Dr
- 15408 Quail Run Dr
- 15400 Jones Ln
- 12904 Scarlet Oak Dr