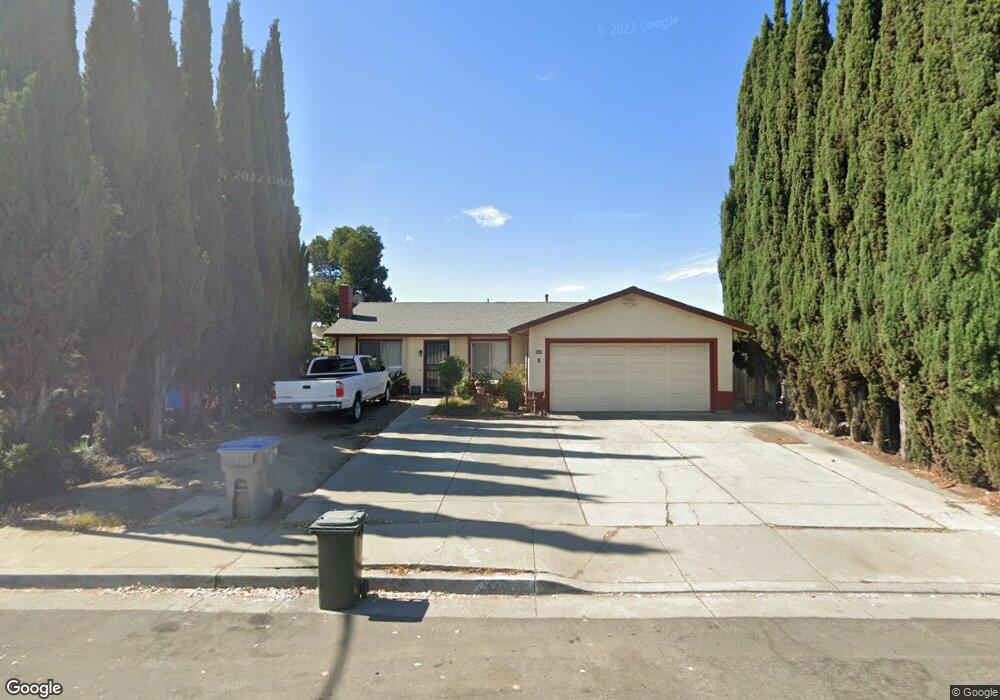
1546 Denali Way San Jose, CA 95122
Overfelt NeighborhoodEstimated Value: $784,000 - $1,076,000
4
Beds
2
Baths
1,139
Sq Ft
$836/Sq Ft
Est. Value
About This Home
This home is located at 1546 Denali Way, San Jose, CA 95122 and is currently estimated at $952,223, approximately $836 per square foot. 1546 Denali Way is a home located in Santa Clara County with nearby schools including Katherine R. Smith Elementary School, George V. Leyva Intermediate School, and William C. Overfelt High School.
Ownership History
Date
Name
Owned For
Owner Type
Purchase Details
Closed on
Mar 1, 2024
Sold by
Paneda Annie K
Bought by
Annie Khamvongsa Paneda Living Trust and Paneda
Current Estimated Value
Purchase Details
Closed on
May 3, 2001
Sold by
Paneda Salvador and Paneda Annie K
Bought by
Paneda Salvador and Paneda Annie K
Home Financials for this Owner
Home Financials are based on the most recent Mortgage that was taken out on this home.
Original Mortgage
$236,000
Interest Rate
7.03%
Purchase Details
Closed on
Mar 16, 1999
Sold by
Thep Khamrouam Mani
Bought by
Paneda Salvador and Paneda Amphone
Home Financials for this Owner
Home Financials are based on the most recent Mortgage that was taken out on this home.
Original Mortgage
$95,006
Interest Rate
6.73%
Create a Home Valuation Report for This Property
The Home Valuation Report is an in-depth analysis detailing your home's value as well as a comparison with similar homes in the area
Home Values in the Area
Average Home Value in this Area
Purchase History
| Date | Buyer | Sale Price | Title Company |
|---|---|---|---|
| Annie Khamvongsa Paneda Living Trust | -- | None Listed On Document | |
| Paneda Salvador | -- | Alliance Title Company | |
| Paneda Salvador | -- | Fidelity National Title Co |
Source: Public Records
Mortgage History
| Date | Status | Borrower | Loan Amount |
|---|---|---|---|
| Previous Owner | Paneda Salvador | $236,000 | |
| Previous Owner | Paneda Salvador | $95,006 |
Source: Public Records
Tax History Compared to Growth
Tax History
| Year | Tax Paid | Tax Assessment Tax Assessment Total Assessment is a certain percentage of the fair market value that is determined by local assessors to be the total taxable value of land and additions on the property. | Land | Improvement |
|---|---|---|---|---|
| 2025 | $5,013 | $277,020 | $110,804 | $166,216 |
| 2024 | $5,013 | $271,589 | $108,632 | $162,957 |
| 2023 | $4,885 | $266,264 | $106,502 | $159,762 |
| 2022 | $4,852 | $261,044 | $104,414 | $156,630 |
| 2021 | $4,722 | $255,926 | $102,367 | $153,559 |
| 2020 | $4,504 | $253,303 | $101,318 | $151,985 |
| 2019 | $4,374 | $248,337 | $99,332 | $149,005 |
| 2018 | $4,298 | $243,469 | $97,385 | $146,084 |
| 2017 | $4,223 | $238,696 | $95,476 | $143,220 |
| 2016 | $4,026 | $234,016 | $93,604 | $140,412 |
| 2015 | $3,966 | $230,501 | $92,198 | $138,303 |
| 2014 | $3,454 | $225,986 | $90,392 | $135,594 |
Source: Public Records
Map
Nearby Homes
- 1381 Taper Ct
- 2040 Lanai Ave
- 1058 Tekman Dr Unit 58
- 2015 Tahiti Ct
- 1117 Indian Summer Ct Unit 4
- 1117 Indian Summer Ct
- 1087 Summerain Ct
- 1231 Turtlerock Dr
- 1077 Summerain Ct
- 1042 Summermist Ct Unit 107
- 1050 Summermist Ct
- 2175 Summerton Dr
- 1068 Summershore Ct
- 1887 Aberdeen Ct
- 988 Summerplace Dr
- 2647 Aida Ave
- 2566 Boren Dr
- 1051 Keldon Dr
- 1412 Joe Dimaggio Ct
- 2116 Galveston Ave Unit B
- 1542 Denali Way
- 1550 Denali Way
- 1538 Denali Way
- 1554 Denali Way
- 1545 Denali Way
- 1541 Denali Way
- 1534 Denali Way
- 1553 Denali Way
- 1558 Denali Way
- 1537 Denali Way
- 1565 Denali Way
- 1530 Denali Way
- 1562 Denali Way
- 2328 Tolbert Ct
- 1529 Denali Way
- 2334 Tolbert Ct
- 2322 Tolbert Ct
- 1571 Denali Way
- 1566 Denali Way
- 1526 Denali Way