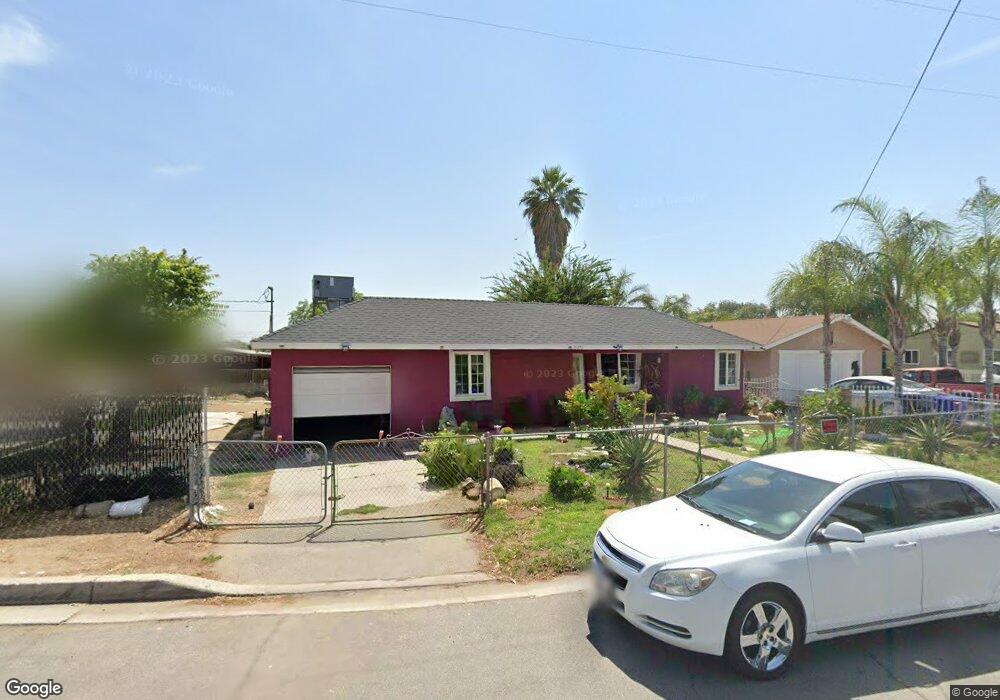
15473 Rosemary Dr Fontana, CA 92335
Estimated Value: $339,000 - $592,000
2
Beds
1
Bath
805
Sq Ft
$571/Sq Ft
Est. Value
About This Home
This home is located at 15473 Rosemary Dr, Fontana, CA 92335 and is currently estimated at $459,577, approximately $570 per square foot. 15473 Rosemary Dr is a home located in San Bernardino County with nearby schools including Poplar Elementary School, Sequoia Middle School, and Jurupa Hills High School.
Ownership History
Date
Name
Owned For
Owner Type
Purchase Details
Closed on
Jul 11, 2001
Sold by
Hud
Bought by
Hernandez Jose and Hernandez Rosa
Current Estimated Value
Home Financials for this Owner
Home Financials are based on the most recent Mortgage that was taken out on this home.
Original Mortgage
$70,200
Interest Rate
7.09%
Purchase Details
Closed on
Feb 25, 2000
Sold by
Countrywide Home Loans Inc
Bought by
Hud
Purchase Details
Closed on
Feb 24, 2000
Sold by
Torres Javier O
Bought by
Countrywide Home Loans Inc
Purchase Details
Closed on
Feb 22, 1997
Sold by
Ramirez Jose Q
Bought by
Torres Javier O
Home Financials for this Owner
Home Financials are based on the most recent Mortgage that was taken out on this home.
Original Mortgage
$70,434
Interest Rate
7.56%
Mortgage Type
FHA
Purchase Details
Closed on
Sep 13, 1996
Sold by
Ramirez Jose Q
Bought by
New Haven Corp
Purchase Details
Closed on
Sep 11, 1996
Sold by
Ramirez Jose Q and Murillo Jesus
Bought by
Ramirez Jose Q
Create a Home Valuation Report for This Property
The Home Valuation Report is an in-depth analysis detailing your home's value as well as a comparison with similar homes in the area
Home Values in the Area
Average Home Value in this Area
Purchase History
| Date | Buyer | Sale Price | Title Company |
|---|---|---|---|
| Hernandez Jose | $78,000 | Landsafe Title | |
| Hud | -- | Landsafe Title | |
| Countrywide Home Loans Inc | $74,293 | Landsafe Title | |
| Torres Javier O | $70,500 | American Title | |
| New Haven Corp | -- | -- | |
| Ramirez Jose Q | -- | -- |
Source: Public Records
Mortgage History
| Date | Status | Borrower | Loan Amount |
|---|---|---|---|
| Previous Owner | Hernandez Jose | $70,200 | |
| Previous Owner | Torres Javier O | $70,434 |
Source: Public Records
Tax History Compared to Growth
Tax History
| Year | Tax Paid | Tax Assessment Tax Assessment Total Assessment is a certain percentage of the fair market value that is determined by local assessors to be the total taxable value of land and additions on the property. | Land | Improvement |
|---|---|---|---|---|
| 2025 | $1,640 | $115,233 | $28,809 | $86,424 |
| 2024 | $1,640 | $112,973 | $28,244 | $84,729 |
| 2023 | $1,175 | $110,758 | $27,690 | $83,068 |
| 2022 | $1,170 | $108,586 | $27,147 | $81,439 |
| 2021 | $1,156 | $106,457 | $26,615 | $79,842 |
| 2020 | $1,153 | $105,365 | $26,342 | $79,023 |
| 2019 | $1,118 | $103,299 | $25,825 | $77,474 |
| 2018 | $1,135 | $101,274 | $25,319 | $75,955 |
| 2017 | $1,129 | $99,289 | $24,823 | $74,466 |
| 2016 | $1,110 | $97,342 | $24,336 | $73,006 |
| 2015 | $1,096 | $95,879 | $23,970 | $71,909 |
| 2014 | $1,097 | $94,000 | $23,500 | $70,500 |
Source: Public Records
Map
Nearby Homes
- 9963 Eugenia Ave
- 9756 Elm Ave
- 15082 Valley Blvd
- 9828 Carob Ave
- 17377 20 Valley Blvd
- 14770 Boyle Ave
- 15278 Boyle Ave
- 15162 Cambria St
- 15937 Manzanita Dr
- 15798 Slover Ave Unit 18
- 9408 Poplar Ave
- 15867 Randall Ave
- 9310 Carob St
- 15994 Sequoia Ave
- 15141 Randall Ave
- 15413 Pine Ave
- 15317 Athol St
- 9831 Oleander Ave
- 9823 Oleander Ave
- 10149 Oleander Ave