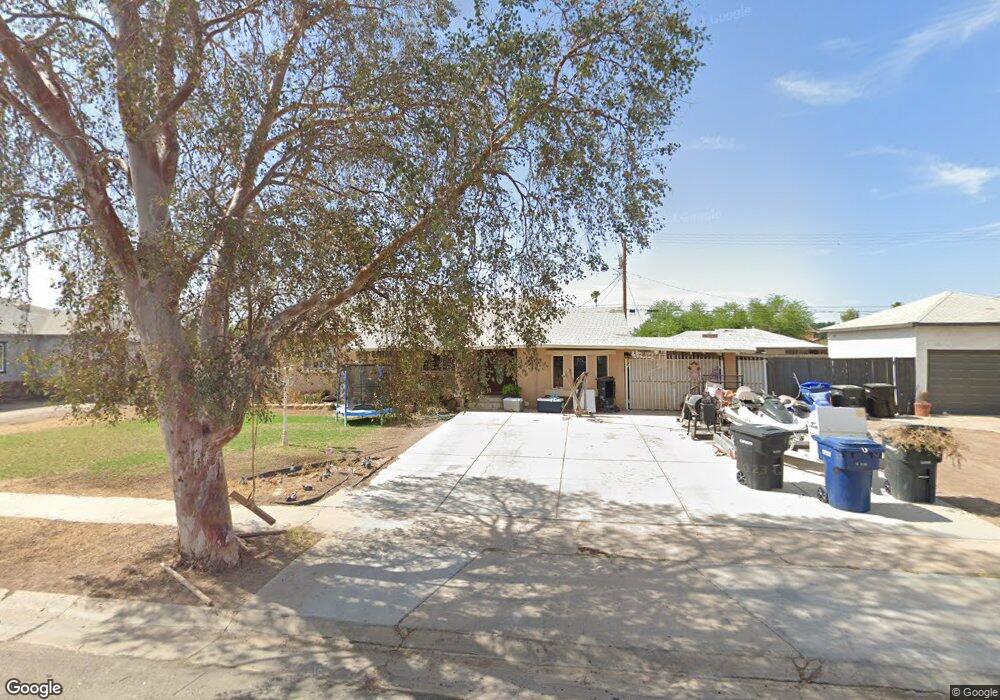
1549 W Holt Ave El Centro, CA 92243
Estimated Value: $297,886 - $340,000
3
Beds
1
Bath
1,286
Sq Ft
$252/Sq Ft
Est. Value
About This Home
This home is located at 1549 W Holt Ave, El Centro, CA 92243 and is currently estimated at $324,222, approximately $252 per square foot. 1549 W Holt Ave is a home located in Imperial County with nearby schools including Margaret Hedrick Elementary School, Wilson Jr. High, and Central Union High School.
Ownership History
Date
Name
Owned For
Owner Type
Purchase Details
Closed on
Mar 19, 2024
Sold by
Gutierrez Lidia G
Bought by
Gutierrez Lidia G and Gutierrez Norma
Current Estimated Value
Purchase Details
Closed on
Jul 19, 2012
Sold by
Gutierrez Miguel A
Bought by
Gutierrez Lidia G
Purchase Details
Closed on
Aug 13, 2002
Sold by
Wong Christine K
Bought by
Gutierrez Miguel A and Gutierrez Lidia G
Home Financials for this Owner
Home Financials are based on the most recent Mortgage that was taken out on this home.
Original Mortgage
$110,533
Interest Rate
6.43%
Mortgage Type
FHA
Purchase Details
Closed on
Apr 27, 1999
Sold by
Va
Bought by
Chavez Luis E and Chavez Irma P
Purchase Details
Closed on
Jan 21, 1999
Sold by
Chavez Luis E and Chavez Irma P
Bought by
Wong Christine K
Home Financials for this Owner
Home Financials are based on the most recent Mortgage that was taken out on this home.
Original Mortgage
$83,600
Interest Rate
7.64%
Create a Home Valuation Report for This Property
The Home Valuation Report is an in-depth analysis detailing your home's value as well as a comparison with similar homes in the area
Home Values in the Area
Average Home Value in this Area
Purchase History
| Date | Buyer | Sale Price | Title Company |
|---|---|---|---|
| Gutierrez Lidia G | -- | None Listed On Document | |
| Gutierrez Lidia G | -- | None Available | |
| Gutierrez Miguel A | $128,000 | Commonwealth Land Title Co | |
| Chavez Luis E | -- | Chicago Title | |
| Wong Christine K | $88,000 | Chicago Title Co |
Source: Public Records
Mortgage History
| Date | Status | Borrower | Loan Amount |
|---|---|---|---|
| Previous Owner | Gutierrez Miguel A | $110,533 | |
| Previous Owner | Wong Christine K | $83,600 | |
| Closed | Gutierrez Miguel A | $18,485 |
Source: Public Records
Tax History Compared to Growth
Tax History
| Year | Tax Paid | Tax Assessment Tax Assessment Total Assessment is a certain percentage of the fair market value that is determined by local assessors to be the total taxable value of land and additions on the property. | Land | Improvement |
|---|---|---|---|---|
| 2025 | $2,122 | $198,092 | $49,231 | $148,861 |
| 2023 | $2,122 | $190,402 | $47,320 | $143,082 |
| 2022 | $2,023 | $186,670 | $46,393 | $140,277 |
| 2021 | $1,970 | $183,011 | $45,484 | $137,527 |
| 2020 | $2,006 | $181,135 | $45,018 | $136,117 |
| 2019 | $1,944 | $177,585 | $44,136 | $133,449 |
| 2018 | $1,932 | $174,104 | $43,271 | $130,833 |
| 2017 | $1,911 | $170,691 | $42,423 | $128,268 |
| 2016 | $1,870 | $167,345 | $41,592 | $125,753 |
| 2015 | $1,553 | $139,746 | $35,000 | $104,746 |
| 2014 | $1,565 | $139,746 | $35,000 | $104,746 |
Source: Public Records
Map
Nearby Homes
- 1732 W Brighton Ave Unit A
- 1732 W Olive Ave Unit B
- 1239 W Heil Ave
- 376 Hamilton Ave
- 1066 W Heil Ave
- 2011 W Holt Ave
- 1653 W Barbara Worth Dr Unit 1653
- 1027 W Holt Ave
- 730 S 8th St
- 1401 S La Brucherie Rd Unit 14
- 1630 Adams Ave Unit 2
- 1066 S 8th St
- 1940 Yucca Dr
- 1425 Pepper Dr
- 1112 S 8th St
- 436 W Euclid Ave
- 1245 Aurora Dr
- 1710 W Euclid Ave Unit 8
- 1090 Aurora Dr
- 734 Broadway Ave
- 1543 W Holt Ave
- 1555 W Holt Ave
- 1548 W Heil Ave
- 1542 W Heil Ave
- 1554 W Heil Ave
- 1537 W Holt Ave
- 1561 W Holt Ave
- 1548 W Holt Ave
- 1536 W Heil Ave
- 1560 W Heil Ave
- 1542 W Holt Ave
- 1554 W Holt Ave
- 1531 W Holt Ave
- 1567 W Holt Ave
- 1536 W Holt Ave
- 1560 W Holt Ave
- 1530 W Heil Ave
- 1566 W Heil Ave
- 1530 W Holt Ave
- 1566 W Holt Ave