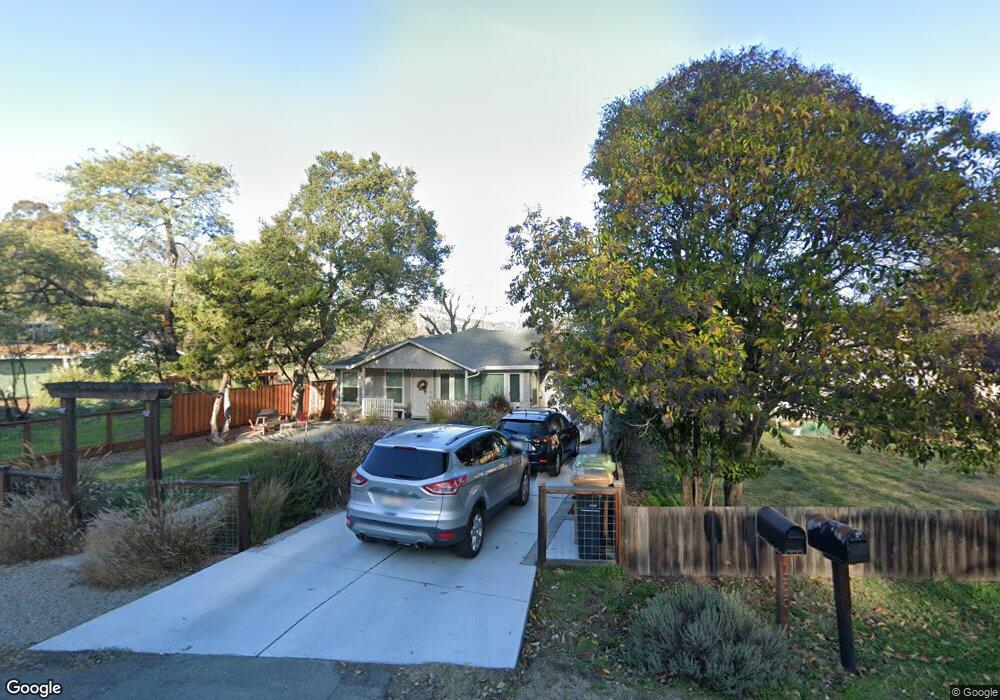
155 Auburn St San Rafael, CA 94901
Picnic Valley NeighborhoodEstimated Value: $893,000 - $962,000
2
Beds
1
Bath
901
Sq Ft
$1,035/Sq Ft
Est. Value
About This Home
This home is located at 155 Auburn St, San Rafael, CA 94901 and is currently estimated at $932,379, approximately $1,034 per square foot. 155 Auburn St is a home located in Marin County with nearby schools including Laurel Dell Elementary School, Coleman Elementary School, and James B. Davidson Middle School.
Ownership History
Date
Name
Owned For
Owner Type
Purchase Details
Closed on
Dec 8, 2023
Sold by
Brew Michael A and Brew Katherine M
Bought by
Pierceco Properties
Current Estimated Value
Purchase Details
Closed on
Oct 26, 2016
Sold by
Mcmahon Derek J and Mcmahon Michelle F
Bought by
Brew Michael A and Brew Katherine M
Home Financials for this Owner
Home Financials are based on the most recent Mortgage that was taken out on this home.
Original Mortgage
$596,400
Interest Rate
3.5%
Mortgage Type
New Conventional
Purchase Details
Closed on
Apr 8, 1998
Sold by
Gavigan Myrtle E Trust 1996 and Brown Edwin M Jr Tr
Bought by
Mcmahon Derek J and Mcmahon Michelle F
Home Financials for this Owner
Home Financials are based on the most recent Mortgage that was taken out on this home.
Original Mortgage
$17,000
Interest Rate
7.07%
Mortgage Type
Credit Line Revolving
Purchase Details
Closed on
May 23, 1996
Sold by
Gavigan Myrtle E
Bought by
Gavigan Myrtle E and Brown Edwin M
Create a Home Valuation Report for This Property
The Home Valuation Report is an in-depth analysis detailing your home's value as well as a comparison with similar homes in the area
Home Values in the Area
Average Home Value in this Area
Purchase History
| Date | Buyer | Sale Price | Title Company |
|---|---|---|---|
| Pierceco Properties | -- | None Listed On Document | |
| Brew Michael A | $745,500 | Fidelity National Title Co | |
| Mcmahon Derek J | $170,000 | First American Title Co | |
| Gavigan Myrtle E | -- | -- |
Source: Public Records
Mortgage History
| Date | Status | Borrower | Loan Amount |
|---|---|---|---|
| Previous Owner | Brew Michael A | $596,400 | |
| Previous Owner | Mcmahon Derek J | $17,000 | |
| Previous Owner | Mcmahon Derek J | $136,000 |
Source: Public Records
Tax History Compared to Growth
Tax History
| Year | Tax Paid | Tax Assessment Tax Assessment Total Assessment is a certain percentage of the fair market value that is determined by local assessors to be the total taxable value of land and additions on the property. | Land | Improvement |
|---|---|---|---|---|
| 2025 | $12,245 | $865,197 | $638,308 | $226,889 |
| 2024 | $12,245 | $848,236 | $625,795 | $222,441 |
| 2023 | $11,988 | $831,605 | $613,525 | $218,080 |
| 2022 | $11,345 | $815,300 | $601,496 | $213,804 |
| 2021 | $11,171 | $799,317 | $589,704 | $209,613 |
| 2020 | $11,053 | $791,124 | $583,660 | $207,464 |
| 2019 | $10,747 | $775,618 | $572,220 | $203,398 |
| 2018 | $10,640 | $760,410 | $561,000 | $199,410 |
| 2017 | $10,240 | $745,500 | $550,000 | $195,500 |
| 2016 | $4,044 | $227,270 | $119,367 | $107,903 |
| 2015 | $3,869 | $223,856 | $117,574 | $106,282 |
| 2014 | $3,686 | $219,472 | $115,272 | $104,200 |
Source: Public Records
Map
Nearby Homes
- 148 Auburn St
- 110 Auburn St
- 35 Hillview Ave
- 124 Tiburon Blvd
- 19 Mliss Ln
- 325 Via la Cumbre
- 370 Via la Cumbre
- 10 Hazel Ct
- 4 Meadow Ave
- 81 Corte Gracitas
- 24 La Loma Ct
- 490 Canal St Unit 6
- 56 Mooring Rd Unit 2
- 150 Bungalow Ave
- 142 Bungalow Ave
- 296 N Almenar Dr
- 321 N Almenar Dr
- 4 Point San Pedro Rd Unit 4
- 35 Fairfax St Unit 8
- 22 Fairfax St Unit B