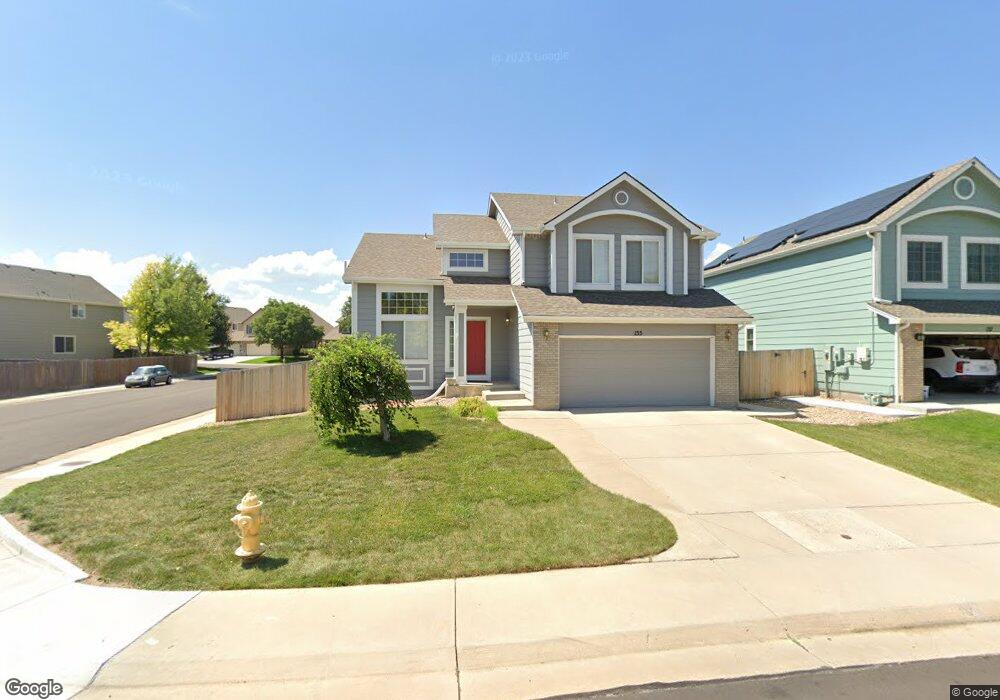
155 Hampstead Ave Castle Rock, CO 80104
Founders Village NeighborhoodEstimated Value: $585,000 - $602,000
4
Beds
4
Baths
2,659
Sq Ft
$224/Sq Ft
Est. Value
About This Home
This home is located at 155 Hampstead Ave, Castle Rock, CO 80104 and is currently estimated at $595,481, approximately $223 per square foot. 155 Hampstead Ave is a home located in Douglas County with nearby schools including Rock Ridge Elementary School, Mesa Middle School, and Douglas County High School.
Ownership History
Date
Name
Owned For
Owner Type
Purchase Details
Closed on
Nov 5, 2015
Sold by
Hinz Randa
Bought by
Emanuel Randa
Current Estimated Value
Purchase Details
Closed on
Nov 13, 2007
Sold by
Aurora Loan Services Llc
Bought by
Hinz Randa
Home Financials for this Owner
Home Financials are based on the most recent Mortgage that was taken out on this home.
Original Mortgage
$220,000
Interest Rate
6.43%
Mortgage Type
Unknown
Purchase Details
Closed on
Jul 27, 2007
Sold by
Clark Marcia A and Clark Mark
Bought by
Aurora Loan Services Llc
Purchase Details
Closed on
Mar 21, 2000
Sold by
Engle Homes Colorado Inc
Bought by
Clark Mark and Clark Marcia A
Home Financials for this Owner
Home Financials are based on the most recent Mortgage that was taken out on this home.
Original Mortgage
$187,400
Interest Rate
8.27%
Purchase Details
Closed on
Sep 17, 1999
Sold by
Sdm/Adm Colo Co
Bought by
Engle Homes Colo Inc
Create a Home Valuation Report for This Property
The Home Valuation Report is an in-depth analysis detailing your home's value as well as a comparison with similar homes in the area
Home Values in the Area
Average Home Value in this Area
Purchase History
| Date | Buyer | Sale Price | Title Company |
|---|---|---|---|
| Emanuel Randa | $220,000 | None Available | |
| Hinz Randa | $220,000 | Chicago Title Co | |
| Aurora Loan Services Llc | -- | None Available | |
| Clark Mark | $197,300 | Universal Land Title | |
| Engle Homes Colo Inc | $308,000 | -- |
Source: Public Records
Mortgage History
| Date | Status | Borrower | Loan Amount |
|---|---|---|---|
| Previous Owner | Hinz Randa | $220,000 | |
| Previous Owner | Clark Mark | $187,400 |
Source: Public Records
Tax History Compared to Growth
Tax History
| Year | Tax Paid | Tax Assessment Tax Assessment Total Assessment is a certain percentage of the fair market value that is determined by local assessors to be the total taxable value of land and additions on the property. | Land | Improvement |
|---|---|---|---|---|
| 2024 | $6,113 | $40,890 | $9,050 | $31,840 |
| 2023 | $6,148 | $40,890 | $9,050 | $31,840 |
| 2022 | $4,574 | $28,890 | $6,610 | $22,280 |
| 2021 | $4,659 | $28,890 | $6,610 | $22,280 |
| 2020 | $4,418 | $28,200 | $5,600 | $22,600 |
| 2019 | $4,420 | $28,200 | $5,600 | $22,600 |
| 2018 | $3,814 | $24,150 | $4,310 | $19,840 |
| 2017 | $3,672 | $24,150 | $4,310 | $19,840 |
| 2016 | $3,237 | $22,230 | $4,110 | $18,120 |
| 2015 | $3,278 | $22,230 | $4,110 | $18,120 |
| 2014 | $2,782 | $18,110 | $3,420 | $14,690 |
Source: Public Records
Map
Nearby Homes
- 321 Lockwood St
- 378 Benton St
- 176 S Pembrook St
- 4590 Wakefield Ave
- 4372 E Andover Ave
- 510 Fairhaven St
- 5181 Devon Ave
- 630 Fairhaven St
- 576 S Lindsey St
- 596 S Lindsey St
- 5282 Devon Ave
- 152 Las Lunas St
- 160 Las Lunas St
- NA Ridge Rd
- 5323 E Sandpiper Ave
- 5326 E Howe St
- 535 Howe St
- 1005 Parsons Ave
- 487 Hideaway Ct
- 5230 E Kensington Ave
- 137 Hampstead Ave
- 181 Lockwood St
- 193 Hampstead Ave
- 123 Hampstead Ave
- 168 Hampstead Ave
- 200 Lockwood St
- 144 Hampstead Ave
- 182 Hampstead Ave
- 111 Hampstead Ave
- 187 Lockwood St
- 211 Hampstead Ave
- 130 Hampstead Ave
- 196 Hampstead Ave
- 199 Lockwood St
- 116 Hampstead Ave
- 240 Lockwood St
- 109 Hampstead Ave
- 231 Hampstead Ave
- 102 Hampstead Ave
- 212 Hampstead Ave