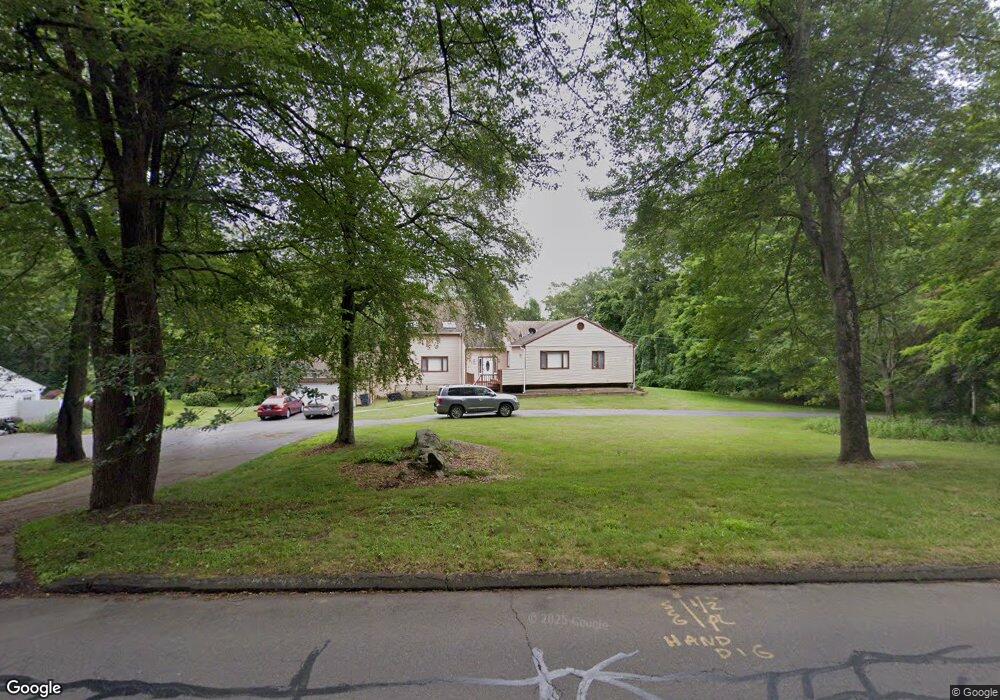
155 Northford Rd Branford, CT 06405
Estimated Value: $719,000 - $957,000
3
Beds
4
Baths
3,493
Sq Ft
$230/Sq Ft
Est. Value
About This Home
This home is located at 155 Northford Rd, Branford, CT 06405 and is currently estimated at $803,228, approximately $229 per square foot. 155 Northford Rd is a home located in New Haven County with nearby schools including Francis Walsh Intermediate School, Branford High School, and St Mary School.
Ownership History
Date
Name
Owned For
Owner Type
Purchase Details
Closed on
Oct 15, 2024
Sold by
Alam Mallick Q
Bought by
Malick Q Alam Lt and Alam
Current Estimated Value
Purchase Details
Closed on
Jul 31, 2014
Sold by
Blakeslee Robert
Bought by
Pastore Leighann
Purchase Details
Closed on
Oct 20, 2000
Sold by
Ahmed Sheikh I
Bought by
Alam Mallick Q
Home Financials for this Owner
Home Financials are based on the most recent Mortgage that was taken out on this home.
Original Mortgage
$207,200
Interest Rate
7.88%
Purchase Details
Closed on
Apr 11, 2000
Sold by
Ahmed Syed S
Bought by
Ahmed Sheikh I
Purchase Details
Closed on
Jan 5, 2000
Sold by
Ahmed Syed S
Bought by
Ahmed Sheikh I
Purchase Details
Closed on
Sep 30, 1998
Sold by
Liberty Sb
Bought by
Ahmed Syed S
Create a Home Valuation Report for This Property
The Home Valuation Report is an in-depth analysis detailing your home's value as well as a comparison with similar homes in the area
Home Values in the Area
Average Home Value in this Area
Purchase History
| Date | Buyer | Sale Price | Title Company |
|---|---|---|---|
| Malick Q Alam Lt | -- | None Available | |
| Malick Q Alam Lt | -- | None Available | |
| Pastore Leighann | $8,000 | -- | |
| Alam Mallick Q | $296,000 | -- | |
| Ahmed Sheikh I | $315,000 | -- | |
| Ahmed Sheikh I | $280,000 | -- | |
| Ahmed Syed S | $225,000 | -- | |
| Pastore Leighann | $8,000 | -- | |
| Alam Mallick Q | $296,000 | -- | |
| Ahmed Sheikh I | $315,000 | -- | |
| Ahmed Sheikh I | $280,000 | -- | |
| Ahmed Syed S | $225,000 | -- |
Source: Public Records
Mortgage History
| Date | Status | Borrower | Loan Amount |
|---|---|---|---|
| Previous Owner | Ahmed Syed S | $318,750 | |
| Previous Owner | Ahmed Syed S | $207,200 |
Source: Public Records
Tax History Compared to Growth
Tax History
| Year | Tax Paid | Tax Assessment Tax Assessment Total Assessment is a certain percentage of the fair market value that is determined by local assessors to be the total taxable value of land and additions on the property. | Land | Improvement |
|---|---|---|---|---|
| 2025 | $9,645 | $450,700 | $114,600 | $336,100 |
| 2024 | $9,388 | $308,000 | $96,500 | $211,500 |
| 2023 | $9,206 | $308,000 | $96,500 | $211,500 |
| 2022 | $9,071 | $308,000 | $96,500 | $211,500 |
| 2021 | $9,071 | $308,000 | $96,500 | $211,500 |
| 2020 | $8,907 | $308,000 | $96,500 | $211,500 |
| 2019 | $8,506 | $292,600 | $96,500 | $196,100 |
| 2018 | $8,380 | $292,600 | $96,500 | $196,100 |
| 2017 | $8,330 | $292,600 | $96,500 | $196,100 |
| 2016 | $8,020 | $292,600 | $96,500 | $196,100 |
| 2015 | $7,880 | $292,600 | $96,500 | $196,100 |
| 2014 | $7,562 | $288,200 | $100,400 | $187,800 |
Source: Public Records
Map
Nearby Homes
- 18 Ridge Acres Rd
- 13 Pond View Terrace
- 132 Linsley Lake Rd
- 27 Hickory Hill Ln
- 22 Hickory Hill Ln
- 21 Featherbed Ln
- 11 School Ground Rd Unit TRLR 10
- 525 E Main St Unit 33
- 525 E Main St Unit 23
- 525 E Main St Unit 56
- 525 E Main St Unit 44
- 525 E Main St Unit 8
- 0 Gould Ln
- 229 Branford Rd Unit 519
- 229 Branford Rd Unit 520
- 21 Manorwood Dr Unit 21
- 10 Lea Rd
- 63 Gould Ln
- 10 Corbin Cir
- 20 Twin Lakes Rd Unit 10
- 169 Northford Rd
- 143 Northford Rd
- 177 Northford Rd
- 14 Partridge Ln
- 150 Northford Rd
- 137 Northford Rd
- 185 Northford Rd
- 11 Partridge Ln
- 11 Partridge Ln
- 12 Partridge Ln
- 10 Partridge Ln
- 131 Northford Rd
- 5 Brookhills Rd
- 5 Partridge Ln
- 9 Partridge Ln
- 197 Northford Rd
- 7 Partridge Ln
- 9 Partridge Ln
- 15 Brookhills Rd
- 8 Partridge Ln