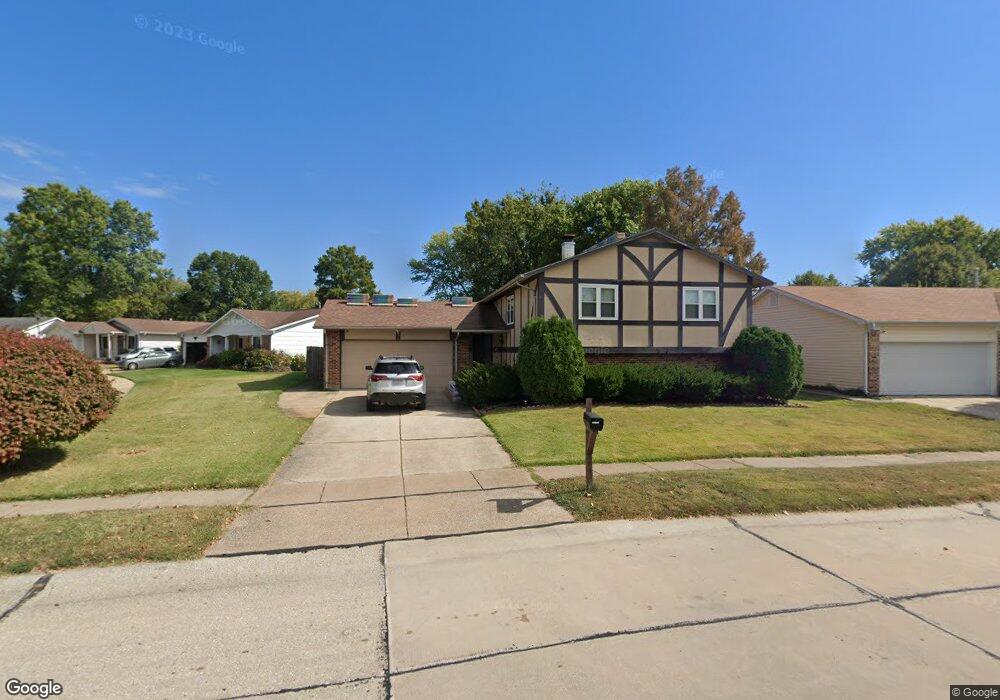
15574 Fox Plains Dr Florissant, MO 63034
Estimated Value: $214,000 - $239,000
--
Bed
3
Baths
1,275
Sq Ft
$177/Sq Ft
Est. Value
About This Home
This home is located at 15574 Fox Plains Dr, Florissant, MO 63034 and is currently estimated at $225,193, approximately $176 per square foot. 15574 Fox Plains Dr is a home located in St. Louis County with nearby schools including Barrington Elementary School, North Middle School, and Hazelwood Central High School.
Ownership History
Date
Name
Owned For
Owner Type
Purchase Details
Closed on
Mar 23, 2024
Sold by
Jordan John Wesley and Jordan Ella R
Bought by
Jordan John Wesley and Jordan Ella R
Current Estimated Value
Create a Home Valuation Report for This Property
The Home Valuation Report is an in-depth analysis detailing your home's value as well as a comparison with similar homes in the area
Home Values in the Area
Average Home Value in this Area
Purchase History
| Date | Buyer | Sale Price | Title Company |
|---|---|---|---|
| Jordan John Wesley | -- | None Listed On Document |
Source: Public Records
Tax History Compared to Growth
Tax History
| Year | Tax Paid | Tax Assessment Tax Assessment Total Assessment is a certain percentage of the fair market value that is determined by local assessors to be the total taxable value of land and additions on the property. | Land | Improvement |
|---|---|---|---|---|
| 2025 | $3,164 | $40,500 | $4,860 | $35,640 |
| 2024 | $3,164 | $35,040 | $4,220 | $30,820 |
| 2023 | $3,153 | $35,040 | $4,220 | $30,820 |
| 2022 | $2,839 | $28,050 | $6,480 | $21,570 |
| 2021 | $2,686 | $28,050 | $6,480 | $21,570 |
| 2020 | $2,498 | $24,280 | $4,860 | $19,420 |
| 2019 | $2,478 | $24,280 | $4,860 | $19,420 |
| 2018 | $2,522 | $22,860 | $3,230 | $19,630 |
| 2017 | $2,520 | $22,860 | $3,230 | $19,630 |
| 2016 | $2,344 | $20,900 | $3,230 | $17,670 |
| 2015 | $2,255 | $20,900 | $3,230 | $17,670 |
| 2014 | $2,328 | $21,490 | $4,140 | $17,350 |
Source: Public Records
Map
Nearby Homes
- 4120 90th Ave
- 623 Bugle Run Dr
- 3914 Birkemeier Dr
- 15684 Birkemeier Dr
- 14736 Verdun Estates Dr
- 3811 Halter Ct
- 738 Waterfall Dr
- 15467 Jost Main St
- 4097 Fox Island Dr
- 3716 Rue de Renard
- 4242 Vaile Ave
- 644 Shadow Rock Dr
- 15509 Debridge Way
- 3870 Hope Haven Dr
- 989 Brookfield Chase Ct
- 3898 Hirondelle Ln
- 1025 Exacta Ct
- 3929 Hirondelle Ln
- 519 Greenway Chase Ct
- 4368 Keevenshore Dr
- 15568 Fox Plains Dr
- 15626 93rd Ave
- 15621 93rd Ave
- 15562 Fox Plains Dr
- 15632 93rd Ave
- 15575 Fox Plains Dr
- 15569 Fox Plains Dr
- 15619 91st Ave
- 15637 93rd Ave
- 15625 91st Ave
- 15613 91st Ave
- 15581 Fox Plains Dr
- 15563 Fox Plains Dr
- 15556 Fox Plains Dr
- 15638 93rd Ave
- 15631 91st Ave
- 15584 Fox Plains Dr
- 15607 91st Ave
- 15557 Fox Plains Dr
- 15643 93rd Ave