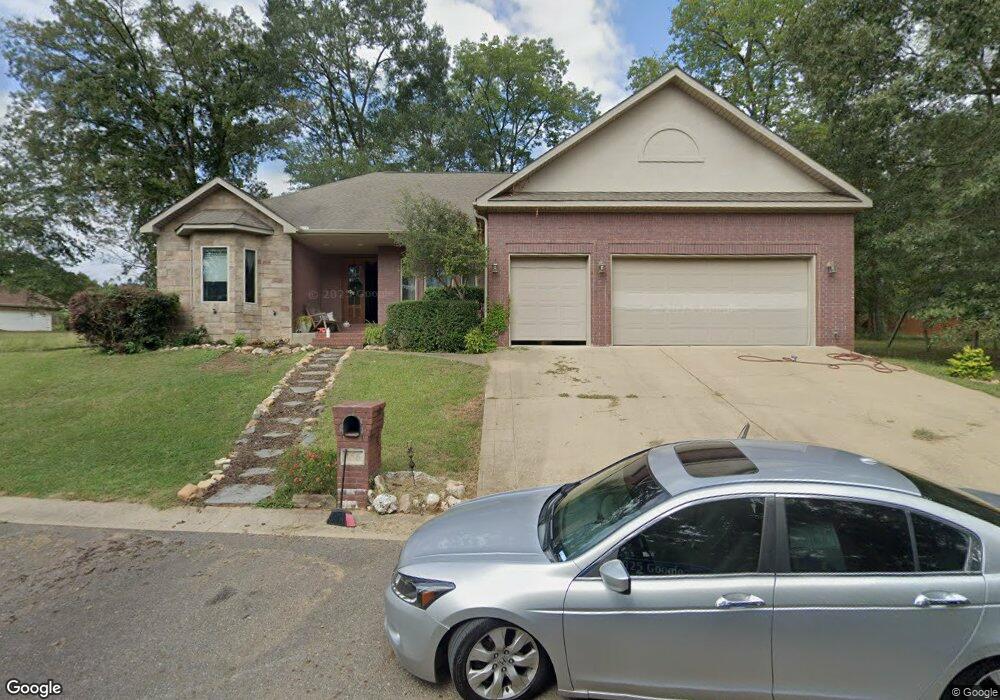
156 Enchanted Dr Hot Springs National Park, AR 71913
Estimated Value: $336,000 - $360,000
3
Beds
2
Baths
2,146
Sq Ft
$163/Sq Ft
Est. Value
About This Home
This home is located at 156 Enchanted Dr, Hot Springs National Park, AR 71913 and is currently estimated at $349,466, approximately $162 per square foot. 156 Enchanted Dr is a home located in Garland County with nearby schools including Lakeside Primary School, Lakeside Intermediate School, and Lakeside Junior High School.
Ownership History
Date
Name
Owned For
Owner Type
Purchase Details
Closed on
Dec 16, 2019
Sold by
Ellis Tully L and Ellis Christina B
Bought by
Fielder Derek
Current Estimated Value
Home Financials for this Owner
Home Financials are based on the most recent Mortgage that was taken out on this home.
Original Mortgage
$199,192
Outstanding Balance
$175,616
Interest Rate
3.6%
Mortgage Type
VA
Estimated Equity
$173,850
Purchase Details
Closed on
Jul 18, 2012
Sold by
Arvest Bank
Bought by
Ellis Tully L and Ellis Christina B
Home Financials for this Owner
Home Financials are based on the most recent Mortgage that was taken out on this home.
Original Mortgage
$178,571
Interest Rate
3.7%
Mortgage Type
New Conventional
Purchase Details
Closed on
Jun 24, 2011
Sold by
Sarver Gerald B
Bought by
Arvest Bank
Purchase Details
Closed on
Jan 11, 2010
Sold by
Sarver Jerry and Lyon Lynda
Bought by
Sarver Gerald B
Purchase Details
Closed on
Sep 4, 2006
Sold by
Mystie Shores Development Llc
Bought by
Sarver Jerry
Create a Home Valuation Report for This Property
The Home Valuation Report is an in-depth analysis detailing your home's value as well as a comparison with similar homes in the area
Home Values in the Area
Average Home Value in this Area
Purchase History
| Date | Buyer | Sale Price | Title Company |
|---|---|---|---|
| Fielder Derek | $195,000 | Hot Springs Title Co | |
| Ellis Tully L | -- | Hot Springs Co Inc | |
| Arvest Bank | $182,139 | None Available | |
| Sarver Gerald B | -- | None Available | |
| Sarver Jerry | $25,000 | None Available |
Source: Public Records
Mortgage History
| Date | Status | Borrower | Loan Amount |
|---|---|---|---|
| Open | Fielder Derek | $199,192 | |
| Previous Owner | Ellis Tully L | $178,571 |
Source: Public Records
Tax History Compared to Growth
Tax History
| Year | Tax Paid | Tax Assessment Tax Assessment Total Assessment is a certain percentage of the fair market value that is determined by local assessors to be the total taxable value of land and additions on the property. | Land | Improvement |
|---|---|---|---|---|
| 2025 | $2,605 | $58,740 | $3,750 | $54,990 |
| 2024 | $2,387 | $58,740 | $3,750 | $54,990 |
| 2023 | $2,203 | $58,740 | $3,750 | $54,990 |
| 2022 | $2,133 | $58,740 | $3,750 | $54,990 |
| 2021 | $1,958 | $40,890 | $3,750 | $37,140 |
| 2020 | $1,958 | $40,890 | $3,750 | $37,140 |
| 2019 | $1,477 | $40,890 | $3,750 | $37,140 |
| 2018 | $1,608 | $40,890 | $3,750 | $37,140 |
| 2017 | $1,339 | $40,890 | $3,750 | $37,140 |
| 2016 | $1,386 | $42,040 | $3,750 | $38,290 |
| 2015 | $1,386 | $42,040 | $3,750 | $38,290 |
| 2014 | $1,386 | $42,040 | $3,750 | $38,290 |
Source: Public Records
Map
Nearby Homes
- LOT 2 Enchanted Cove
- lot 3 Enchanted
- lot 1 Enchanted
- 121 Blue Moon Terrace
- Lot #2 Blue Moon Terrace
- Lot 2 Blue Moon Terrace
- Lot 14 Blue Moon Terrace
- Lot 3 Blue Moon Terrace
- Lot 16 Blue Moon Terrace
- Lot 15 Blue Moon Terrace
- 347 Diamondhead Dr
- 307 Diamondhead Dr
- Lot 2126 Diamondhead Dr
- Lot 2934 Diamondhead Dr
- 1587 Diamondhead Dr
- Lot 2128 Diamondhead Dr
- Lot 2127 Diamondhead Dr
- Lot 2396 Diamondhead Dr
- 150 Enchanted Cove
- 156 Enchanted Cove
- 32 Enchanted Terrace
- lots 2-7 Enchanted Cove
- lot 26 Enchanted Cove
- lot 23 Enchanted Cove
- LOT 12/14 Enchanted Cove
- LOT 8 Enchanted Cove
- LOT 7 Enchanted Cove
- LOT 5 Enchanted Cove
- LOT 6 Enchanted Cove
- LOT 4 Enchanted Cove
- 12 & 14 Enchanted Cove
- Lot 15 Enchanted Cove
- 0 Enchanted Cove
- 0 Enchanted Terrace Unit 108456
- 0 Enchanted Terrace
- lot 39 Enchanted Cove
- 115 Enchanted Terrace
- 109 Enchanted Terrace