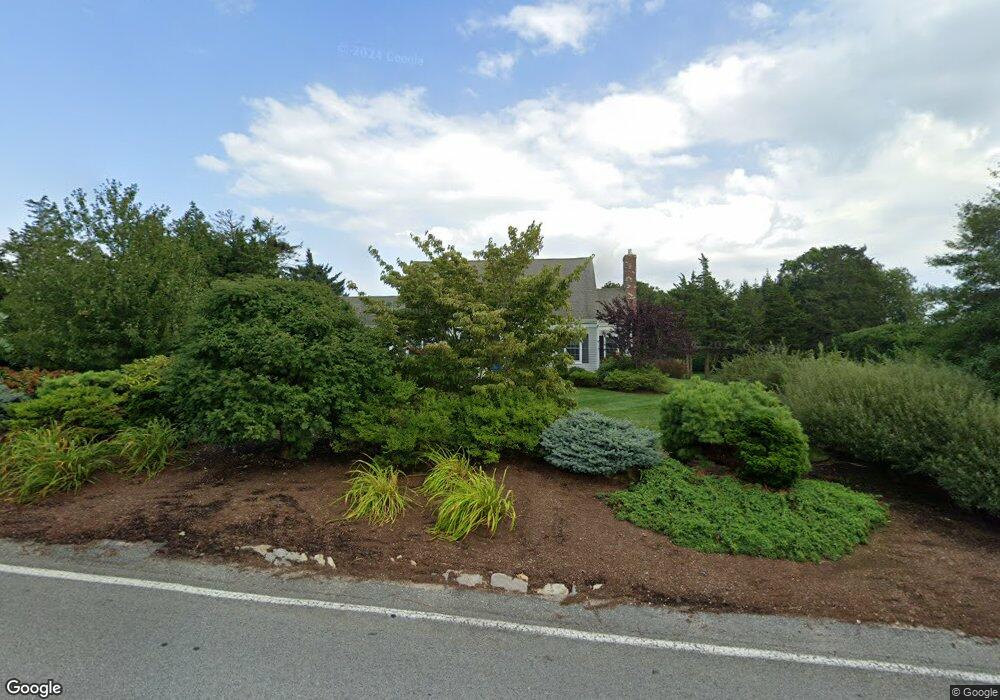
156 Gorham Rd Harwich Port, MA 02646
Harwich Port NeighborhoodEstimated Value: $1,437,000 - $2,062,645
4
Beds
2
Baths
1,805
Sq Ft
$960/Sq Ft
Est. Value
About This Home
This home is located at 156 Gorham Rd, Harwich Port, MA 02646 and is currently estimated at $1,732,911, approximately $960 per square foot. 156 Gorham Rd is a home located in Barnstable County with nearby schools including Harwich Elementary School, Chatham Elementary School, and Monomoy Regional Middle School.
Ownership History
Date
Name
Owned For
Owner Type
Purchase Details
Closed on
Aug 16, 2022
Sold by
John A Harvey T 1998
Bought by
156 Gorham Road Llc
Current Estimated Value
Purchase Details
Closed on
Jul 30, 2013
Sold by
Harvey John and Harvey John A
Bought by
John A Harvey T and Harvey Linda G
Purchase Details
Closed on
Jul 6, 2010
Sold by
Gorham 156 Rt and Mcphee John S
Bought by
Harvey John and Harvey Linda
Purchase Details
Closed on
Jul 24, 2008
Sold by
Corbett Lynne F and Leone William J
Bought by
Corbett Lynne F and Leone William J
Purchase Details
Closed on
Nov 23, 1998
Sold by
Hathaway Raeburn B and Hathaway Janet H
Bought by
Leone William J and Corbett Lynne F
Home Financials for this Owner
Home Financials are based on the most recent Mortgage that was taken out on this home.
Original Mortgage
$176,000
Interest Rate
6.49%
Mortgage Type
Purchase Money Mortgage
Create a Home Valuation Report for This Property
The Home Valuation Report is an in-depth analysis detailing your home's value as well as a comparison with similar homes in the area
Home Values in the Area
Average Home Value in this Area
Purchase History
| Date | Buyer | Sale Price | Title Company |
|---|---|---|---|
| 156 Gorham Road Llc | -- | None Available | |
| John A Harvey T | -- | -- | |
| Harvey John | $410,000 | -- | |
| Corbett Lynne F | -- | -- | |
| Leone William J | $220,000 | -- |
Source: Public Records
Mortgage History
| Date | Status | Borrower | Loan Amount |
|---|---|---|---|
| Previous Owner | Leone William J | $220,000 | |
| Previous Owner | Leone William J | $40,000 | |
| Previous Owner | Leone William J | $176,000 |
Source: Public Records
Tax History Compared to Growth
Tax History
| Year | Tax Paid | Tax Assessment Tax Assessment Total Assessment is a certain percentage of the fair market value that is determined by local assessors to be the total taxable value of land and additions on the property. | Land | Improvement |
|---|---|---|---|---|
| 2025 | $9,620 | $1,627,700 | $400,300 | $1,227,400 |
| 2024 | $9,261 | $1,535,900 | $440,500 | $1,095,400 |
| 2023 | $8,540 | $1,286,100 | $343,300 | $942,800 |
| 2022 | $8,169 | $1,007,300 | $278,600 | $728,700 |
| 2021 | $8,045 | $935,500 | $226,200 | $709,300 |
| 2020 | $8,025 | $919,200 | $225,500 | $693,700 |
| 2019 | $7,756 | $894,600 | $216,700 | $677,900 |
| 2018 | $7,667 | $845,900 | $197,000 | $648,900 |
| 2017 | $7,321 | $816,200 | $179,700 | $636,500 |
| 2016 | $6,979 | $769,500 | $179,700 | $589,800 |
| 2015 | $6,771 | $754,900 | $176,200 | $578,700 |
| 2014 | $6,478 | $738,700 | $170,900 | $567,800 |
Source: Public Records
Map
Nearby Homes
- 820 Massachusetts 28
- 8 Old Wharf Rd
- 53 Freeman St
- 9 Jason Ln
- 15 Shannon Rd
- 28 Dale Rd
- 106 Chatham Rd
- 27 Quaker Ln
- 21 Princes St
- 15 Pleasant St Unit W24
- 303 Bank St
- 44 Beriah Brooks Rd
- 42 Marthas Ln
- 515 Massachusetts 28
- 515 Route 28
- 116 Parallel St
- 6 Marthas Ln
- 4 Hope Ln
- 1011 Massachusetts 28 Unit C-6
- 1011 Route 28 Unit 6