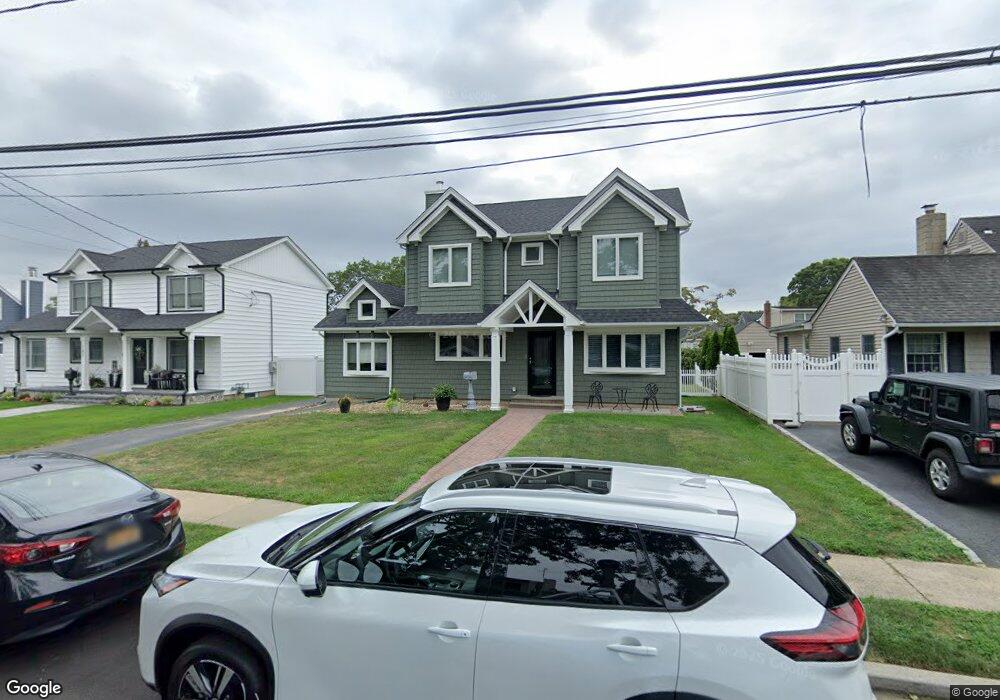
156 Hayes St Massapequa Park, NY 11762
Estimated Value: $641,791 - $680,000
--
Bed
1
Bath
1,310
Sq Ft
$505/Sq Ft
Est. Value
About This Home
This home is located at 156 Hayes St, Massapequa Park, NY 11762 and is currently estimated at $660,896, approximately $504 per square foot. 156 Hayes St is a home located in Nassau County with nearby schools including Massapequa High School - Ames Campus, Berner Middle School, and Massapequa High School.
Ownership History
Date
Name
Owned For
Owner Type
Purchase Details
Closed on
Oct 29, 1999
Sold by
Arnold Walter J
Bought by
Regan Peter G and Regan Lorie M
Current Estimated Value
Home Financials for this Owner
Home Financials are based on the most recent Mortgage that was taken out on this home.
Original Mortgage
$175,000
Outstanding Balance
$53,140
Interest Rate
7.68%
Mortgage Type
Purchase Money Mortgage
Estimated Equity
$607,756
Purchase Details
Closed on
Jan 24, 1997
Create a Home Valuation Report for This Property
The Home Valuation Report is an in-depth analysis detailing your home's value as well as a comparison with similar homes in the area
Home Values in the Area
Average Home Value in this Area
Purchase History
| Date | Buyer | Sale Price | Title Company |
|---|---|---|---|
| Regan Peter G | $190,000 | Commonwealth Land Title Ins | |
| -- | -- | -- |
Source: Public Records
Mortgage History
| Date | Status | Borrower | Loan Amount |
|---|---|---|---|
| Open | Regan Peter G | $175,000 |
Source: Public Records
Tax History Compared to Growth
Tax History
| Year | Tax Paid | Tax Assessment Tax Assessment Total Assessment is a certain percentage of the fair market value that is determined by local assessors to be the total taxable value of land and additions on the property. | Land | Improvement |
|---|---|---|---|---|
| 2025 | $11,678 | $436 | $182 | $254 |
| 2024 | $2,993 | $442 | $184 | $258 |
| 2023 | $11,186 | $457 | $191 | $266 |
| 2022 | $11,186 | $468 | $196 | $272 |
| 2021 | $9,854 | $442 | $184 | $258 |
| 2020 | $8,878 | $585 | $584 | $1 |
| 2019 | $8,418 | $627 | $608 | $19 |
| 2018 | $8,329 | $668 | $0 | $0 |
| 2017 | $5,674 | $710 | $510 | $200 |
| 2016 | $8,387 | $902 | $648 | $254 |
| 2015 | $3,045 | $902 | $648 | $254 |
| 2014 | $3,045 | $902 | $648 | $254 |
| 2013 | $2,849 | $902 | $648 | $254 |
Source: Public Records
Map
Nearby Homes