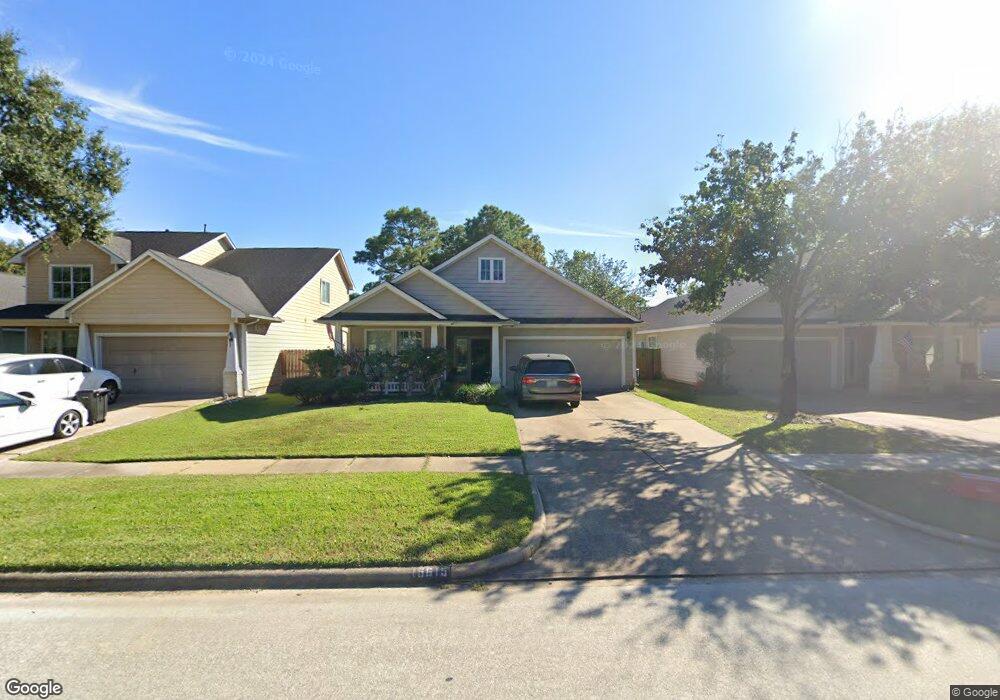
15615 Tylermont Dr Cypress, TX 77429
Estimated Value: $309,969 - $343,000
3
Beds
2
Baths
1,696
Sq Ft
$190/Sq Ft
Est. Value
About This Home
This home is located at 15615 Tylermont Dr, Cypress, TX 77429 and is currently estimated at $322,492, approximately $190 per square foot. 15615 Tylermont Dr is a home located in Harris County with nearby schools including Sampson Elementary School, Spillane Middle School, and Cypress Woods High School.
Ownership History
Date
Name
Owned For
Owner Type
Purchase Details
Closed on
Aug 24, 2020
Sold by
Sowers Melody A
Bought by
Morales Antonio and Morales Rachel
Current Estimated Value
Home Financials for this Owner
Home Financials are based on the most recent Mortgage that was taken out on this home.
Original Mortgage
$145,500
Outstanding Balance
$128,828
Interest Rate
2.9%
Mortgage Type
New Conventional
Estimated Equity
$193,664
Purchase Details
Closed on
Sep 21, 2009
Sold by
Mangum Jerry G
Bought by
Sowers Melody A
Home Financials for this Owner
Home Financials are based on the most recent Mortgage that was taken out on this home.
Original Mortgage
$142,373
Interest Rate
5.36%
Mortgage Type
FHA
Purchase Details
Closed on
Nov 21, 2000
Sold by
Newmark Homes Lp
Bought by
Mangum Jerry G
Home Financials for this Owner
Home Financials are based on the most recent Mortgage that was taken out on this home.
Original Mortgage
$95,000
Interest Rate
7.84%
Create a Home Valuation Report for This Property
The Home Valuation Report is an in-depth analysis detailing your home's value as well as a comparison with similar homes in the area
Home Values in the Area
Average Home Value in this Area
Purchase History
| Date | Buyer | Sale Price | Title Company |
|---|---|---|---|
| Morales Antonio | -- | Great American Title | |
| Sowers Melody A | -- | Startex 05 Title Company | |
| Mangum Jerry G | -- | Pacific Title |
Source: Public Records
Mortgage History
| Date | Status | Borrower | Loan Amount |
|---|---|---|---|
| Open | Morales Antonio | $145,500 | |
| Previous Owner | Sowers Melody A | $142,373 | |
| Previous Owner | Mangum Jerry G | $95,000 |
Source: Public Records
Tax History Compared to Growth
Tax History
| Year | Tax Paid | Tax Assessment Tax Assessment Total Assessment is a certain percentage of the fair market value that is determined by local assessors to be the total taxable value of land and additions on the property. | Land | Improvement |
|---|---|---|---|---|
| 2025 | $4,587 | $299,504 | $64,800 | $234,704 |
| 2024 | $4,587 | $310,290 | $64,800 | $245,490 |
| 2023 | $4,587 | $288,400 | $64,800 | $223,600 |
| 2022 | $6,635 | $278,411 | $48,000 | $230,411 |
| 2021 | $5,686 | $224,653 | $48,000 | $176,653 |
| 2020 | $5,407 | $207,234 | $38,400 | $168,834 |
| 2019 | $5,471 | $203,332 | $38,400 | $164,932 |
| 2018 | $1,956 | $201,057 | $38,400 | $162,657 |
| 2017 | $5,411 | $201,057 | $38,400 | $162,657 |
| 2016 | $5,411 | $201,057 | $38,400 | $162,657 |
| 2015 | $4,819 | $191,020 | $38,400 | $152,620 |
| 2014 | $4,819 | $176,574 | $38,400 | $138,174 |
Source: Public Records
Map
Nearby Homes
- 13014 Vivienne Westmoreland Dr
- 15803 Stiller Park Dr
- 13718 Sherburn Manor Dr
- 13611 Monteigne Ln
- 16306 Bontura St
- 16322 Bontura St
- 16219 Haden Crest Ct
- 13402 Layton Castle Ln
- 14210 Prospect Point Dr
- 14103 Sherburn Manor Dr
- 15923 Hurstfield Pointe Dr
- 14314 Prosper Ridge Dr
- 13703 Layton Hills Dr
- 16406 Haden Crest Ct
- 16211 Halpren Falls Ln
- 16515 Dunleith Cir
- 12603 Telge Rd Unit 30C-D
- 12603 Telge Rd Unit 26 E-F
- 12603 Telge Rd Unit 8 I-L
- 12719 Shady Knoll Ln
- 15611 Tylermont Dr
- 15619 Tylermont Dr
- 15607 Tylermont Dr
- 12907 Norstrum Falls Ct
- 12910 Stiller Park Ct
- 15627 Tylermont Dr
- 15614 Tylermont Dr
- 12903 Norstrum Falls Ct
- 15610 Tylermont Dr
- 12906 Stiller Park Ct
- 15618 Tylermont Dr
- 13003 Norstrom Falls Ct
- 15703 Tylermont Dr
- 12907 Stiller Park Ct
- 13007 Norstrom Falls Ct
- 15707 Tylermont Dr
- 12902 Norstrum Falls Ct
- 13010 Poydras Ct
- 12902 Stiller Park Ct
- 15706 Tylermont Dr