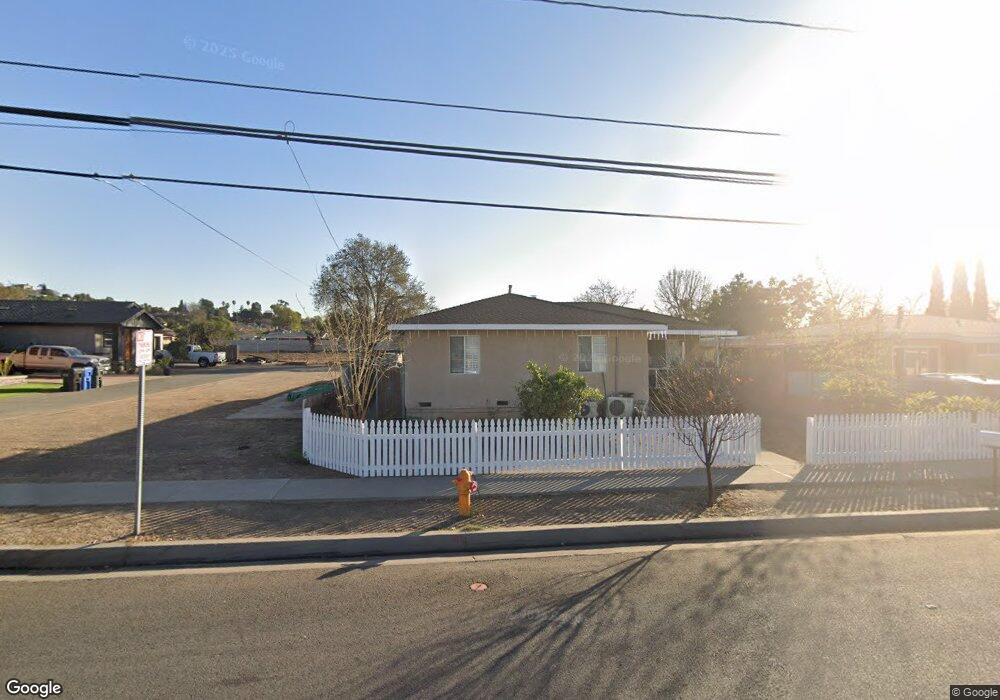
15634 Sierra Vista Ct La Puente, CA 91744
Estimated Value: $853,000 - $899,000
4
Beds
3
Baths
2,310
Sq Ft
$383/Sq Ft
Est. Value
About This Home
This home is located at 15634 Sierra Vista Ct, La Puente, CA 91744 and is currently estimated at $884,506, approximately $382 per square foot. 15634 Sierra Vista Ct is a home located in Los Angeles County with nearby schools including Del Valle Elementary School, Sierra Vista Middle School, and La Puente High School.
Ownership History
Date
Name
Owned For
Owner Type
Purchase Details
Closed on
Aug 24, 2006
Sold by
Tram Susanna
Bought by
Tram Susanna and Tram Trisa
Current Estimated Value
Purchase Details
Closed on
Jun 9, 2003
Sold by
Trenh Khien Khi and Chiem Anh
Bought by
Tram Susanna
Home Financials for this Owner
Home Financials are based on the most recent Mortgage that was taken out on this home.
Original Mortgage
$100,000
Interest Rate
5.61%
Mortgage Type
Purchase Money Mortgage
Purchase Details
Closed on
Feb 24, 1994
Sold by
Trenh Khien Khi and Chien Anh
Bought by
Trenh Khien Khi and Chiem Anh
Home Financials for this Owner
Home Financials are based on the most recent Mortgage that was taken out on this home.
Original Mortgage
$76,000
Interest Rate
6.98%
Purchase Details
Closed on
Sep 24, 1993
Sold by
Chiem Steven
Bought by
Chiem Anh
Create a Home Valuation Report for This Property
The Home Valuation Report is an in-depth analysis detailing your home's value as well as a comparison with similar homes in the area
Home Values in the Area
Average Home Value in this Area
Purchase History
| Date | Buyer | Sale Price | Title Company |
|---|---|---|---|
| Tram Susanna | -- | Accommodation | |
| Tram Susanna | $150,000 | First American Title Co | |
| Trenh Khien Khi | -- | Progressive Title Company | |
| Chiem Anh | -- | Progressive Title |
Source: Public Records
Mortgage History
| Date | Status | Borrower | Loan Amount |
|---|---|---|---|
| Closed | Tram Susanna | $100,000 | |
| Previous Owner | Trenh Khien Khi | $76,000 |
Source: Public Records
Tax History Compared to Growth
Tax History
| Year | Tax Paid | Tax Assessment Tax Assessment Total Assessment is a certain percentage of the fair market value that is determined by local assessors to be the total taxable value of land and additions on the property. | Land | Improvement |
|---|---|---|---|---|
| 2025 | $6,717 | $523,581 | $217,239 | $306,342 |
| 2024 | $6,717 | $513,316 | $212,980 | $300,336 |
| 2023 | $6,552 | $503,252 | $208,804 | $294,448 |
| 2022 | $6,366 | $493,385 | $204,710 | $288,675 |
| 2021 | $6,251 | $483,712 | $200,697 | $283,015 |
| 2019 | $6,076 | $469,368 | $194,746 | $274,622 |
| 2018 | $5,785 | $460,166 | $190,928 | $269,238 |
| 2016 | $5,278 | $442,299 | $183,515 | $258,784 |
| 2015 | $5,181 | $435,656 | $180,759 | $254,897 |
| 2014 | $5,098 | $427,123 | $177,219 | $249,904 |
Source: Public Records
Map
Nearby Homes
- 545 N 5th St
- 15732 Victoria Ave
- 15879 Hill St
- 15416 Giordano St
- 665 Larimore Ave
- 15625 Loukelton St
- 826 Del Valle Ave
- 15246 Temple Ave
- 15900 Rowland St
- 1084 Del Valle Ave
- 14972 Giordano St
- 15925 Amar Rd
- 15937 Amar Rd
- 357 Cadbrook Dr
- 15943 Amar Rd
- 1174 Del Valle Ave
- 15947 Amar Rd
- 16115 Central Ave
- 138 Banbridge Ave
- 11 Alley Way
- 15630 Sierra Vista Ct
- 15624 Sierra Vista Ct
- 15702 Sierra Vista Ct
- 15620 Sierra Vista Ct
- 15708 Sierra Vista Ct
- 15614 Sierra Vista Ct
- 15639 Sierra Vista Ct
- 15712 Sierra Vista Ct
- 15625 Sierra Vista Ct
- 15785 Montana Ave
- 15775 Montana Ave
- 15621 Sierra Vista Ct
- 15716 Sierra Vista Ct
- 15765 Montana Ave
- 15801 Montana Ave
- 15615 Sierra Vista Ct
- 680 Glendora Ave
- 15755 Montana Ave
- 666 Glendora Ave
- 666 Glendora Ave