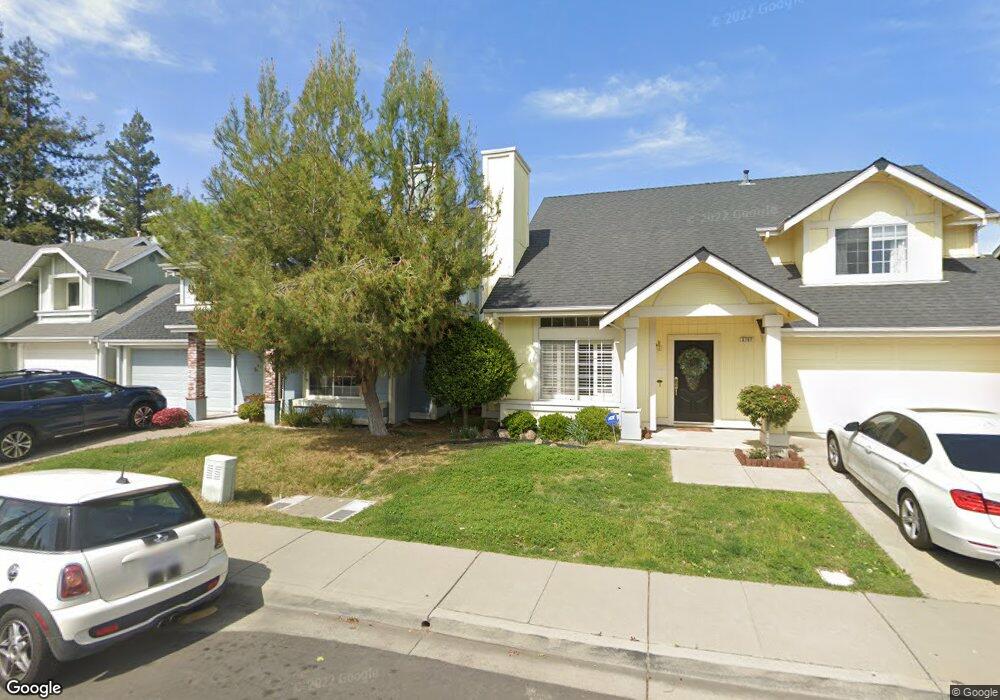
157 Sylvia Cir Pleasanton, CA 94566
Estimated Value: $1,321,756 - $1,515,000
3
Beds
3
Baths
1,671
Sq Ft
$859/Sq Ft
Est. Value
About This Home
This home is located at 157 Sylvia Cir, Pleasanton, CA 94566 and is currently estimated at $1,436,189, approximately $859 per square foot. 157 Sylvia Cir is a home located in Alameda County with nearby schools including Valley View Elementary School, Pleasanton Middle School, and Amador Valley High School.
Ownership History
Date
Name
Owned For
Owner Type
Purchase Details
Closed on
Sep 27, 2012
Sold by
Pelkey Grace Ernestine
Bought by
Lebeau Jacob M and Lebeau Tamera K
Current Estimated Value
Home Financials for this Owner
Home Financials are based on the most recent Mortgage that was taken out on this home.
Original Mortgage
$492,000
Outstanding Balance
$342,614
Interest Rate
3.63%
Mortgage Type
Purchase Money Mortgage
Estimated Equity
$1,093,575
Purchase Details
Closed on
Apr 8, 1998
Sold by
Boynton Mike
Bought by
Pelkey Grace Ernestine
Home Financials for this Owner
Home Financials are based on the most recent Mortgage that was taken out on this home.
Original Mortgage
$206,250
Interest Rate
7.18%
Create a Home Valuation Report for This Property
The Home Valuation Report is an in-depth analysis detailing your home's value as well as a comparison with similar homes in the area
Home Values in the Area
Average Home Value in this Area
Purchase History
| Date | Buyer | Sale Price | Title Company |
|---|---|---|---|
| Lebeau Jacob M | $615,000 | Chicago Title Company | |
| Pelkey Grace Ernestine | $62,000 | Commonwealth Land Title Co |
Source: Public Records
Mortgage History
| Date | Status | Borrower | Loan Amount |
|---|---|---|---|
| Open | Lebeau Jacob M | $492,000 | |
| Previous Owner | Pelkey Grace Ernestine | $206,250 |
Source: Public Records
Tax History Compared to Growth
Tax History
| Year | Tax Paid | Tax Assessment Tax Assessment Total Assessment is a certain percentage of the fair market value that is determined by local assessors to be the total taxable value of land and additions on the property. | Land | Improvement |
|---|---|---|---|---|
| 2025 | $8,694 | $750,298 | $227,189 | $530,109 |
| 2024 | $8,694 | $735,451 | $222,735 | $519,716 |
| 2023 | $8,593 | $727,894 | $218,368 | $509,526 |
| 2022 | $8,140 | $706,627 | $214,088 | $499,539 |
| 2021 | $7,930 | $692,635 | $209,890 | $489,745 |
| 2020 | $7,829 | $692,464 | $207,739 | $484,725 |
| 2019 | $7,922 | $678,891 | $203,667 | $475,224 |
| 2018 | $7,761 | $665,583 | $199,675 | $465,908 |
| 2017 | $7,562 | $652,533 | $195,760 | $456,773 |
| 2016 | $6,979 | $639,741 | $191,922 | $447,819 |
| 2015 | $6,848 | $630,134 | $189,040 | $441,094 |
| 2014 | $6,969 | $617,791 | $185,337 | $432,454 |
Source: Public Records
Map
Nearby Homes
- 215 Mavis Dr
- 373 Linden Way
- 3845 Vineyard Ave Unit F
- 3841 Vineyard Ave Unit 18
- 3839 Vineyard Ave Unit F
- 262 Birch Creek Dr
- 3937 Vine St
- 236 Birch Creek Terrace Unit 14
- 543 Tawny Dr
- 601 Palomino Dr Unit C
- 665 Palomino Dr Unit D
- 3375 Norton Way Unit 5
- 3399 Norton Way Unit 6
- 3263 Vineyard Ave Unit 44
- 3263 Vineyard Ave Unit 68
- 3263 Vineyard Ave Unit 174
- 3263 Vineyard Ave Unit 125
- 3263 Vineyard Ave Unit 132
- 3263 Vineyard Ave
- 3263 Vineyard Ave Unit 89