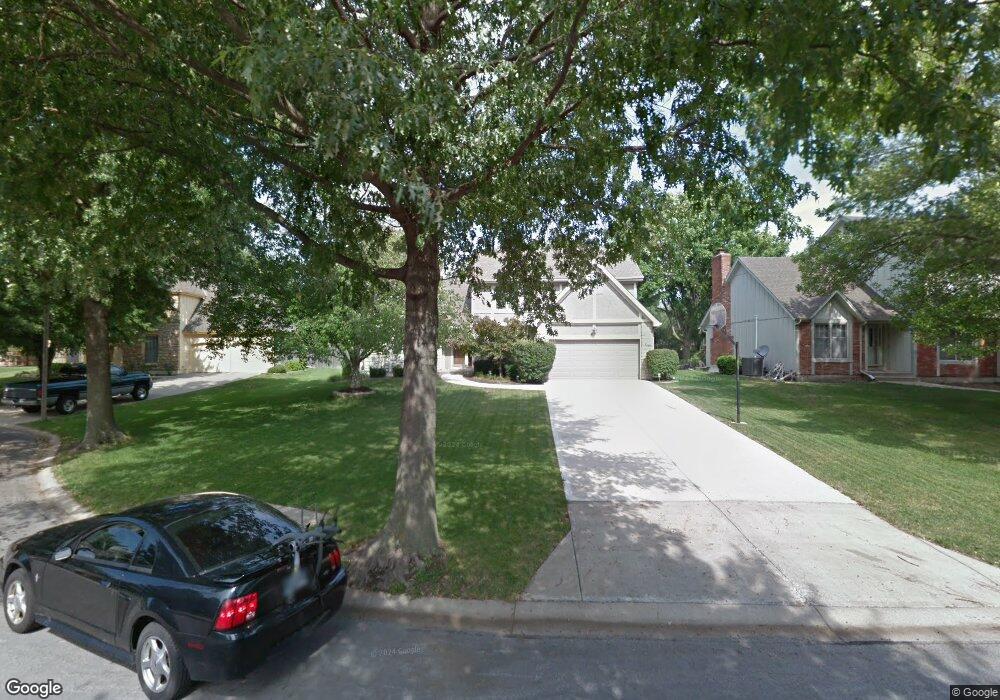
15710 W 92nd Terrace Lenexa, KS 66219
Estimated Value: $450,000 - $460,780
4
Beds
4
Baths
2,459
Sq Ft
$186/Sq Ft
Est. Value
About This Home
This home is located at 15710 W 92nd Terrace, Lenexa, KS 66219 and is currently estimated at $456,195, approximately $185 per square foot. 15710 W 92nd Terrace is a home located in Johnson County with nearby schools including Sunflower Elementary School, Westridge Middle School, and Shawnee Mission West High School.
Ownership History
Date
Name
Owned For
Owner Type
Purchase Details
Closed on
Nov 2, 2009
Sold by
Viveros Esther M
Bought by
Viveros Esther M and The Esther M Viveros Revocable Trust
Current Estimated Value
Purchase Details
Closed on
Sep 29, 2008
Sold by
Klusman Sarah A
Bought by
Viveros Esther M
Purchase Details
Closed on
Sep 9, 2008
Sold by
Klusman Bryce E
Bought by
Klusman Sarah A
Purchase Details
Closed on
Mar 16, 2006
Sold by
Benson Michael M and Benson Jane C
Bought by
Klusman Bryce E and Klusman Sarah A
Home Financials for this Owner
Home Financials are based on the most recent Mortgage that was taken out on this home.
Original Mortgage
$50,000
Interest Rate
6.22%
Mortgage Type
Unknown
Create a Home Valuation Report for This Property
The Home Valuation Report is an in-depth analysis detailing your home's value as well as a comparison with similar homes in the area
Home Values in the Area
Average Home Value in this Area
Purchase History
| Date | Buyer | Sale Price | Title Company |
|---|---|---|---|
| Viveros Esther M | -- | None Available | |
| Viveros Esther M | -- | Chicago Title Insurance Co | |
| Klusman Sarah A | -- | Chicago Title Insurance Co | |
| Klusman Bryce E | -- | Chicago Title Ins Co |
Source: Public Records
Mortgage History
| Date | Status | Borrower | Loan Amount |
|---|---|---|---|
| Previous Owner | Klusman Bryce E | $50,000 | |
| Previous Owner | Klusman Bryce E | $200,000 |
Source: Public Records
Tax History Compared to Growth
Tax History
| Year | Tax Paid | Tax Assessment Tax Assessment Total Assessment is a certain percentage of the fair market value that is determined by local assessors to be the total taxable value of land and additions on the property. | Land | Improvement |
|---|---|---|---|---|
| 2024 | $5,054 | $45,678 | $7,928 | $37,750 |
| 2023 | $4,914 | $43,654 | $7,553 | $36,101 |
| 2022 | $4,576 | $40,618 | $7,190 | $33,428 |
| 2021 | $4,303 | $36,259 | $6,848 | $29,411 |
| 2020 | $4,100 | $34,190 | $6,845 | $27,345 |
| 2019 | $3,927 | $32,718 | $5,956 | $26,762 |
| 2018 | $4,015 | $33,178 | $5,418 | $27,760 |
| 2017 | $3,964 | $31,752 | $4,929 | $26,823 |
| 2016 | $3,708 | $29,314 | $4,929 | $24,385 |
| 2015 | $3,573 | $28,440 | $4,929 | $23,511 |
| 2013 | -- | $25,553 | $4,929 | $20,624 |
Source: Public Records
Map
Nearby Homes
- 9207 Boehm Dr
- 9203 Boehm Dr
- 15320 W 92nd Place
- 15920 W 91st Terrace
- 8943 Boehm Dr
- 9131 Darnell St
- 8946 Country Hill Ct
- 9318 Greenway Ln
- 9202 Greenway Ln
- 15611 W 86th St
- 8919 Greenway Ln
- 8616 Baska Ct
- 9029 Acuff Ln
- 17804 W 96th St
- 17806 W 96th St
- 15529 W 83rd Terrace
- 8641 Greenwood Ln
- 8403 Swarner Dr
- 15322 W 83rd Terrace
- 14101 W 88th Place
- 15706 W 92nd Terrace
- 15714 W 92nd Terrace
- 15702 W 92nd Terrace
- 15718 W 92nd Terrace
- 9214 Allman Rd
- 15709 W 92nd Terrace
- 9219 Loiret Blvd
- 15705 W 92nd Terrace
- 9208 Allman Rd
- 15711 W 92nd Terrace
- 9209 Loiret Blvd
- 9223 Loiret Blvd
- 9217 Loiret Blvd
- 15701 W 92nd Terrace
- 15719 W 92nd Terrace
- 15715 W 92nd Terrace
- 9202 Allman Rd
- 9211 Loiret Blvd
- 9225 Loiret Blvd
- 9235 Loiret Blvd