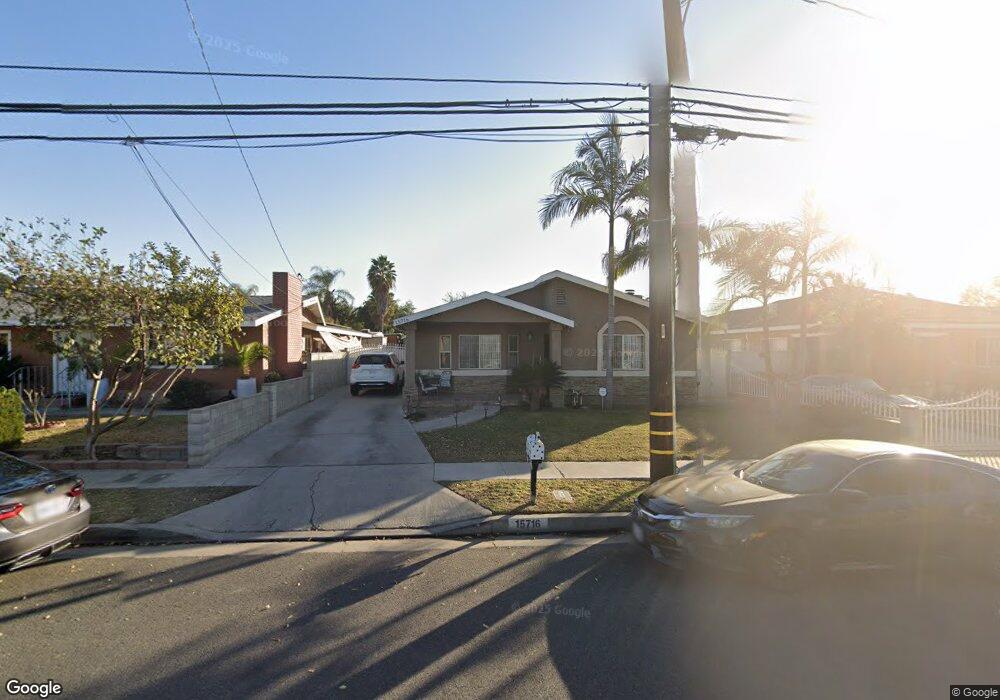
15716 Sierra Vista Ct La Puente, CA 91744
Estimated Value: $768,000 - $861,000
3
Beds
3
Baths
1,592
Sq Ft
$512/Sq Ft
Est. Value
About This Home
This home is located at 15716 Sierra Vista Ct, La Puente, CA 91744 and is currently estimated at $815,239, approximately $512 per square foot. 15716 Sierra Vista Ct is a home located in Los Angeles County with nearby schools including Del Valle Elementary School, Sierra Vista Middle School, and La Puente High School.
Ownership History
Date
Name
Owned For
Owner Type
Purchase Details
Closed on
Sep 17, 2020
Sold by
Parra Javier N and Parra Angelica M
Bought by
Parra Javier N and Parra Angelica M
Current Estimated Value
Home Financials for this Owner
Home Financials are based on the most recent Mortgage that was taken out on this home.
Original Mortgage
$417,000
Outstanding Balance
$370,060
Interest Rate
2.9%
Mortgage Type
New Conventional
Estimated Equity
$445,179
Purchase Details
Closed on
Oct 13, 2000
Sold by
Gutierrez Jose G and Eckstein Ana Maria
Bought by
Parra Javier N
Home Financials for this Owner
Home Financials are based on the most recent Mortgage that was taken out on this home.
Original Mortgage
$164,000
Interest Rate
7.86%
Purchase Details
Closed on
Dec 21, 1999
Sold by
Gutierrez Marisela
Bought by
Gutierrez Jose G
Create a Home Valuation Report for This Property
The Home Valuation Report is an in-depth analysis detailing your home's value as well as a comparison with similar homes in the area
Home Values in the Area
Average Home Value in this Area
Purchase History
| Date | Buyer | Sale Price | Title Company |
|---|---|---|---|
| Parra Javier N | -- | North American Title Company | |
| Parra Javier N | $210,000 | First American | |
| Gutierrez Jose G | -- | First American Title Co | |
| Eckstein Ana Maria | -- | First American Title Co | |
| Gutierrez Jose G | $65,000 | First American Title Co |
Source: Public Records
Mortgage History
| Date | Status | Borrower | Loan Amount |
|---|---|---|---|
| Open | Parra Javier N | $417,000 | |
| Closed | Parra Javier N | $164,000 |
Source: Public Records
Tax History Compared to Growth
Tax History
| Year | Tax Paid | Tax Assessment Tax Assessment Total Assessment is a certain percentage of the fair market value that is determined by local assessors to be the total taxable value of land and additions on the property. | Land | Improvement |
|---|---|---|---|---|
| 2025 | $4,167 | $316,413 | $94,918 | $221,495 |
| 2024 | $4,167 | $310,209 | $93,057 | $217,152 |
| 2023 | $4,065 | $304,128 | $91,233 | $212,895 |
| 2022 | $3,950 | $298,166 | $89,445 | $208,721 |
| 2021 | $3,876 | $292,321 | $87,692 | $204,629 |
| 2019 | $3,769 | $283,652 | $85,092 | $198,560 |
| 2018 | $3,587 | $278,091 | $83,424 | $194,667 |
| 2016 | $3,323 | $267,294 | $80,186 | $187,108 |
| 2015 | $3,262 | $263,280 | $78,982 | $184,298 |
| 2014 | $3,214 | $258,123 | $77,435 | $180,688 |
Source: Public Records
Map
Nearby Homes
- 545 N 5th St
- 15879 Hill St
- 15732 Victoria Ave
- 665 Larimore Ave
- 15625 Loukelton St
- 826 Del Valle Ave
- 15416 Giordano St
- 15900 Rowland St
- 15246 Temple Ave
- 1084 Del Valle Ave
- 15925 Amar Rd
- 15937 Amar Rd
- 15943 Amar Rd
- 15947 Amar Rd
- 11 Alley Way
- 138 Banbridge Ave
- 1174 Del Valle Ave
- 14972 Giordano St
- 16115 Central Ave
- 16322 Main St
- 15724 Sierra Vista Ct
- 15712 Sierra Vista Ct
- 15728 Sierra Vista Ct
- 15708 Sierra Vista Ct
- 15702 Sierra Vista Ct
- 15732 Sierra Vista Ct
- 669 N 5th St
- 663 N 5th St
- 679 N 5th St
- 15821 Montana Ave
- 15634 Sierra Vista Ct
- 15815 Montana Ave
- 15811 Montana Ave
- 15805 Montana Ave
- 15825 Montana Ave
- 657 N 5th St
- 15630 Sierra Vista Ct
- 15801 Montana Ave
- 15802 Sierra Vista Ct
- 15639 Sierra Vista Ct