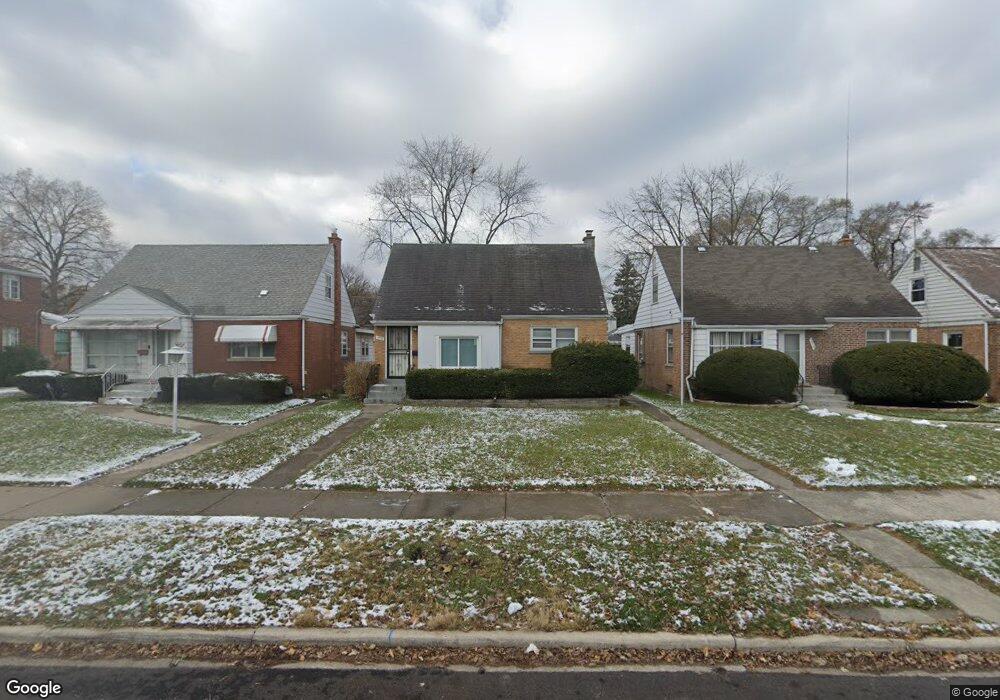
1578 Kenilworth Dr Calumet City, IL 60409
Estimated Value: $164,317 - $178,000
3
Beds
2
Baths
1,280
Sq Ft
$136/Sq Ft
Est. Value
About This Home
This home is located at 1578 Kenilworth Dr, Calumet City, IL 60409 and is currently estimated at $174,079, approximately $135 per square foot. 1578 Kenilworth Dr is a home located in Cook County with nearby schools including Hoover Elementary School, Schrum Memorial Middle School, and Thornton Fractional North High School.
Ownership History
Date
Name
Owned For
Owner Type
Purchase Details
Closed on
Nov 10, 2023
Sold by
Naz Farida
Bought by
Empire Machineries Usa Llc
Current Estimated Value
Purchase Details
Closed on
Oct 18, 2013
Sold by
Beckwith Properties Inc
Bought by
Naz Farida
Purchase Details
Closed on
Dec 29, 2011
Sold by
Secretary Of Housing & Urban Development
Bought by
Beckwith Properties Inc
Purchase Details
Closed on
Oct 1, 2009
Sold by
Miller Floyd
Bought by
The Secretary Of Housing & Urban Develop
Purchase Details
Closed on
Jun 28, 1999
Sold by
Pierscionek Anthony and Lucchesi Maryann
Bought by
Miller Alyson R
Home Financials for this Owner
Home Financials are based on the most recent Mortgage that was taken out on this home.
Original Mortgage
$78,254
Interest Rate
7.93%
Mortgage Type
FHA
Create a Home Valuation Report for This Property
The Home Valuation Report is an in-depth analysis detailing your home's value as well as a comparison with similar homes in the area
Home Values in the Area
Average Home Value in this Area
Purchase History
| Date | Buyer | Sale Price | Title Company |
|---|---|---|---|
| Empire Machineries Usa Llc | -- | None Listed On Document | |
| Naz Farida | $15,000 | None Available | |
| Beckwith Properties Inc | -- | Stewart Title Company | |
| The Secretary Of Housing & Urban Develop | -- | Premier Title Company | |
| Miller Alyson R | $79,000 | -- |
Source: Public Records
Mortgage History
| Date | Status | Borrower | Loan Amount |
|---|---|---|---|
| Previous Owner | Miller Alyson R | $78,254 |
Source: Public Records
Tax History Compared to Growth
Tax History
| Year | Tax Paid | Tax Assessment Tax Assessment Total Assessment is a certain percentage of the fair market value that is determined by local assessors to be the total taxable value of land and additions on the property. | Land | Improvement |
|---|---|---|---|---|
| 2024 | $7,892 | $12,000 | $1,989 | $10,011 |
| 2023 | $5,989 | $12,000 | $1,989 | $10,011 |
| 2022 | $5,989 | $7,024 | $1,755 | $5,269 |
| 2021 | $5,877 | $7,024 | $1,755 | $5,269 |
| 2020 | $4,964 | $7,024 | $1,755 | $5,269 |
| 2019 | $6,920 | $9,308 | $1,638 | $7,670 |
| 2018 | $6,964 | $9,308 | $1,638 | $7,670 |
| 2017 | $6,614 | $9,308 | $1,638 | $7,670 |
| 2016 | $5,112 | $7,585 | $1,521 | $6,064 |
| 2015 | $5,036 | $7,585 | $1,521 | $6,064 |
| 2014 | $4,843 | $7,585 | $1,521 | $6,064 |
| 2013 | $4,056 | $6,867 | $1,521 | $5,346 |
Source: Public Records
Map
Nearby Homes
- 1562 Kenilworth Dr
- 1567 Kenilworth Dr
- 1581 Kenilworth Dr
- 1527 Wentworth Ave
- 32 166th Place
- 36 167th St
- 11 166th St
- 41 167th St
- 1522 Forest Ave
- 1531 Lincoln Ave
- 1532 State Line Rd
- 1514 State Line Rd
- 3514 170th Place
- 12 169th St
- 1473 Wentworth Ave
- 1470 Kenilworth Dr
- 17 167th Place
- 3454 E 170th St
- 1461 Wentworth Ave
- 1464 Shirley Dr
- 1574 Kenilworth Dr
- 1580 Kenilworth Dr
- 1570 Kenilworth Dr
- 1586 Kenilworth Dr
- 1566 Kenilworth Dr
- 1575 Wentworth Ave
- 1573 Wentworth Ave
- 1579 Wentworth Ave
- 1590 Kenilworth Dr
- 1583 Wentworth Ave
- 1583 Wentworth Ave
- 1569 Wentworth Ave
- 1579 Kenilworth Dr
- 1565 Wentworth Ave
- 1575 Kenilworth Dr
- 1571 Kenilworth Dr
- 1587 Kenilworth Dr
- 1587 Wentworth Ave
- 1587 Wentworth Ave
- 1558 Kenilworth Dr