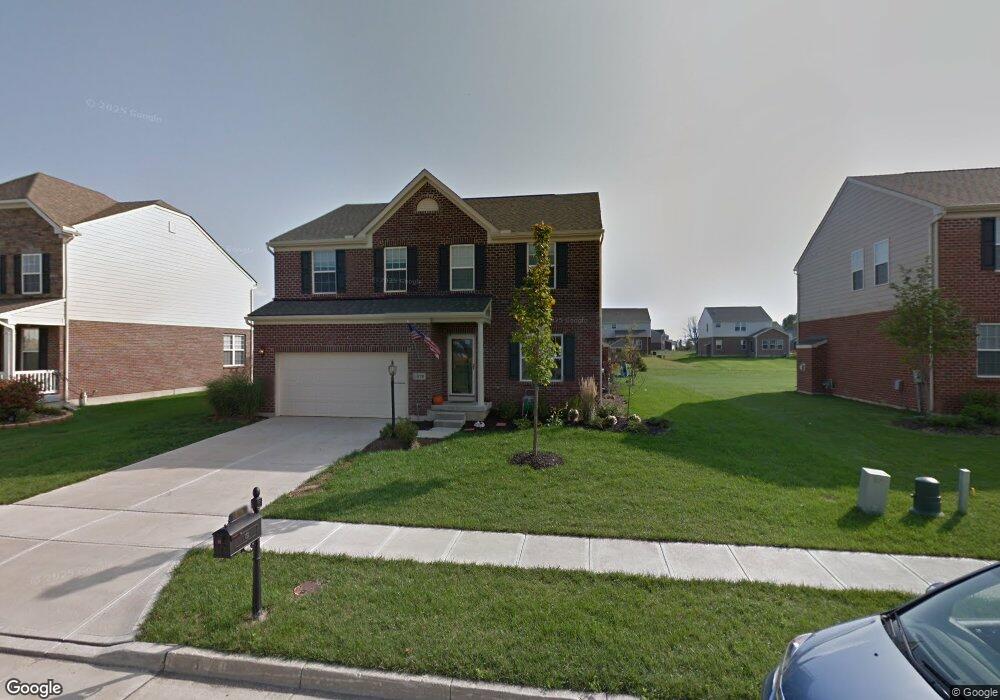
1579 Little Falls Dr Dayton, OH 45458
Clearcreek Township NeighborhoodEstimated Value: $479,131 - $567,000
4
Beds
4
Baths
2,813
Sq Ft
$182/Sq Ft
Est. Value
About This Home
This home is located at 1579 Little Falls Dr, Dayton, OH 45458 and is currently estimated at $511,283, approximately $181 per square foot. 1579 Little Falls Dr is a home located in Warren County with nearby schools including Clearcreek Elementary School, Springboro Intermediate School, and Springboro Junior High School.
Ownership History
Date
Name
Owned For
Owner Type
Purchase Details
Closed on
Jun 29, 2017
Sold by
Hauck Trishia L and Hauck Anthony S
Bought by
Vanderpool Barry E and Vanderpool Kathy J
Current Estimated Value
Home Financials for this Owner
Home Financials are based on the most recent Mortgage that was taken out on this home.
Original Mortgage
$269,000
Outstanding Balance
$223,922
Interest Rate
3.96%
Mortgage Type
VA
Estimated Equity
$287,361
Purchase Details
Closed on
Feb 25, 2010
Sold by
Nvr Inc
Bought by
Hauck Trishia L and Hauck Anthony S
Home Financials for this Owner
Home Financials are based on the most recent Mortgage that was taken out on this home.
Original Mortgage
$213,667
Interest Rate
5.02%
Mortgage Type
VA
Purchase Details
Closed on
Dec 4, 2009
Sold by
Vwc Holdings Ltd
Bought by
Nvr Inc
Purchase Details
Closed on
Jul 8, 2008
Sold by
Beazer Homes Investments Llc
Bought by
Vwc Holdings Ltd
Create a Home Valuation Report for This Property
The Home Valuation Report is an in-depth analysis detailing your home's value as well as a comparison with similar homes in the area
Home Values in the Area
Average Home Value in this Area
Purchase History
| Date | Buyer | Sale Price | Title Company |
|---|---|---|---|
| Vanderpool Barry E | $279,000 | Stewart Title Company | |
| Hauck Trishia L | $221,600 | First Title Agency | |
| Nvr Inc | $35,000 | First Title Agency | |
| Vwc Holdings Ltd | $2,859,500 | Attorney |
Source: Public Records
Mortgage History
| Date | Status | Borrower | Loan Amount |
|---|---|---|---|
| Open | Vanderpool Barry E | $269,000 | |
| Previous Owner | Hauck Trishia L | $213,667 |
Source: Public Records
Tax History Compared to Growth
Tax History
| Year | Tax Paid | Tax Assessment Tax Assessment Total Assessment is a certain percentage of the fair market value that is determined by local assessors to be the total taxable value of land and additions on the property. | Land | Improvement |
|---|---|---|---|---|
| 2024 | $6,242 | $144,340 | $35,000 | $109,340 |
| 2023 | $5,385 | $113,550 | $20,650 | $92,900 |
| 2022 | $5,271 | $113,551 | $20,650 | $92,901 |
| 2021 | $4,980 | $113,551 | $20,650 | $92,901 |
| 2020 | $4,885 | $96,229 | $17,500 | $78,729 |
| 2019 | $4,551 | $96,229 | $17,500 | $78,729 |
| 2018 | $4,203 | $96,229 | $17,500 | $78,729 |
| 2017 | $4,314 | $81,666 | $15,960 | $65,706 |
| 2016 | $4,484 | $81,666 | $15,960 | $65,706 |
| 2015 | $3,646 | $81,666 | $15,960 | $65,706 |
| 2014 | $3,646 | $68,050 | $13,300 | $54,750 |
| 2013 | $3,645 | $89,540 | $17,500 | $72,040 |
Source: Public Records
Map
Nearby Homes
- 1628 N Wood Creek Dr
- 10001 Cobble Brook Dr
- 1680 S Branch Rd
- 1651 Summit Creek Dr
- 9734 Crooked Creek Dr
- Allegheny Plan at Winding Creek
- Bramante Ranch Plan at Winding Creek
- Aviano Plan at Winding Creek
- Lehigh Plan at Winding Creek
- Columbia Plan at Winding Creek
- Ballenger Plan at Winding Creek
- 1235 Bourdeaux Way
- 9313 Maple Brook St
- 1271 Bourdeaux Way
- 1123 Chambrey
- 1124 Petrus Ct
- 9562 Aspen Brook Ct
- 9387 Rochelle Ln
- 9777 Winding Creek Blvd
- 1282 Normandy Rue
- 1573 Little Falls Dr
- 1583 Little Falls Dr
- 1580 Little Falls Dr
- 1567 Little Falls Dr
- 1584 Little Falls Dr
- 1560 Little Falls Dr
- 1591 Little Falls Dr
- 1588 Little Falls Dr
- 1594 N Wood Creek Dr
- 1598 N Wood Creek Dr
- 1578 N Wood Creek Dr
- 1561 Little Falls Dr
- 1604 N Wood Creek Dr
- 1570 N Wood Creek Dr
- 1570 N Wood Creek Dr
- 1595 Little Falls Dr
- 1592 Little Falls Dr
- 1610 N Wood Creek Dr
- 1555 Little Falls Dr
- 1544 Little Falls Dr