Estimated Value: $434,019 - $458,000
3
Beds
2
Baths
1,480
Sq Ft
$304/Sq Ft
Est. Value
About This Home
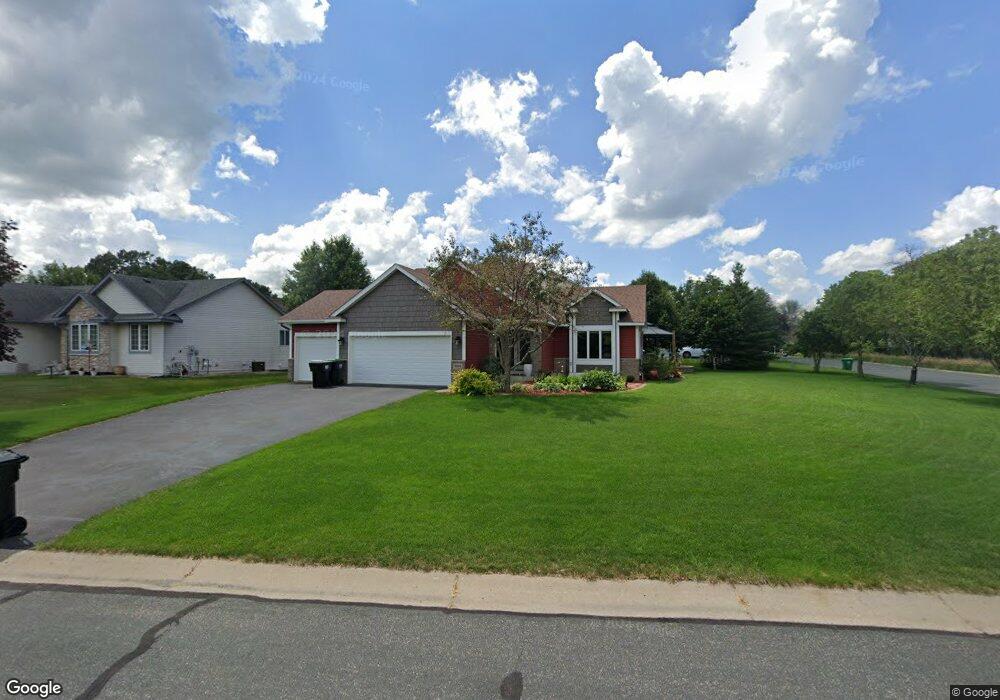
This home is located at 15860 Lithium St NW, Anoka, MN 55303 and is currently estimated at $450,005, approximately $304 per square foot. 15860 Lithium St NW is a home located in Anoka County with nearby schools including Brookside Elementary School, Anoka Middle School for the Arts - Fred Moor Campus, and Anoka Senior High School.
Ownership History
Date
Name
Owned For
Owner Type
Purchase Details
Closed on
Mar 15, 2017
Sold by
Pardo Adam and Pardo Laura
Bought by
Warner Christopher A and Warner Kristin A
Current Estimated Value
Home Financials for this Owner
Home Financials are based on the most recent Mortgage that was taken out on this home.
Original Mortgage
$281,010
Outstanding Balance
$189,187
Interest Rate
4.17%
Mortgage Type
New Conventional
Estimated Equity
$260,818
Purchase Details
Closed on
Oct 31, 2002
Sold by
Morgan Chase Homes Inc
Bought by
Pardo Adam and Pardo Laura
Purchase Details
Closed on
Jun 6, 2002
Sold by
Oakwood Land Development Inc
Bought by
Morgan Chase Homes Inc
Purchase Details
Closed on
Jun 5, 2002
Sold by
Barthold Jacob and Barthold Therese
Bought by
Oakwood Land Development Inc
Create a Home Valuation Report for This Property
The Home Valuation Report is an in-depth analysis detailing your home's value as well as a comparison with similar homes in the area
Home Values in the Area
Average Home Value in this Area
Purchase History
| Date | Buyer | Sale Price | Title Company |
|---|---|---|---|
| Warner Christopher A | $295,800 | Cu Title Services Inc | |
| Pardo Adam | $259,460 | -- | |
| Morgan Chase Homes Inc | $335,000 | -- | |
| Oakwood Land Development Inc | $200,000 | -- |
Source: Public Records
Mortgage History
| Date | Status | Borrower | Loan Amount |
|---|---|---|---|
| Open | Warner Christopher A | $281,010 |
Source: Public Records
Tax History Compared to Growth
Tax History
| Year | Tax Paid | Tax Assessment Tax Assessment Total Assessment is a certain percentage of the fair market value that is determined by local assessors to be the total taxable value of land and additions on the property. | Land | Improvement |
|---|---|---|---|---|
| 2025 | $4,521 | $413,000 | $88,000 | $325,000 |
| 2024 | $4,521 | $405,300 | $81,900 | $323,400 |
| 2023 | $4,130 | $411,700 | $78,000 | $333,700 |
| 2022 | $3,773 | $398,600 | $65,200 | $333,400 |
| 2021 | $3,572 | $332,000 | $54,000 | $278,000 |
| 2020 | $3,692 | $315,800 | $51,000 | $264,800 |
| 2019 | $3,488 | $315,900 | $51,000 | $264,900 |
| 2018 | $3,428 | $292,000 | $0 | $0 |
| 2017 | $3,048 | $278,400 | $0 | $0 |
| 2016 | $3,113 | $248,000 | $0 | $0 |
| 2015 | -- | $248,000 | $49,000 | $199,000 |
| 2014 | -- | $213,100 | $38,000 | $175,100 |
Source: Public Records
Map
Nearby Homes
- 16042 Iodine St NW
- 5695 160th Ln NW
- 5696 154th Cove NW
- 15495 Sodium St NW
- 15363 Radium St NW
- 5901 151st Ln NW
- 5803 151st Ln NW
- 5817 151st Ln NW
- 5845 151st Ln NW
- 5658 152nd Ln NW
- 5907 151st Ln NW
- 15160 Quicksilver St NW
- 15661 Juniper Ridge Dr NW
- 5641 149th Ln NW
- 14795 Krypton Ct NW
- 15108 Ute St NW
- 14950 Waco St NW
- 14683 Sodium St NW
- 17030 Potassium St NW
- 14701 Cobalt St NW Unit 47
- 5790 158th Ln NW
- 15840 Lithium St NW
- 15820 Lithium St NW
- 5791 158th Ave NW
- 5800 158th Ln NW
- 5751 158th Ct NW
- 15873 Lithium St NW
- 5801 158th Ave NW
- 5810 158th Ln NW
- 5750 158th Ct NW
- 15881 Lithium St NW
- 5741 158th Ct NW
- 5815 158th Ave NW
- 5740 158th Ct NW
- 15780 Lithium St NW
- 5820 158th Ln NW
- 5731 158th Ct NW
- 15791 Lithium St NW
- 5811 158th Ln NW
- 5802 158th Ave NW