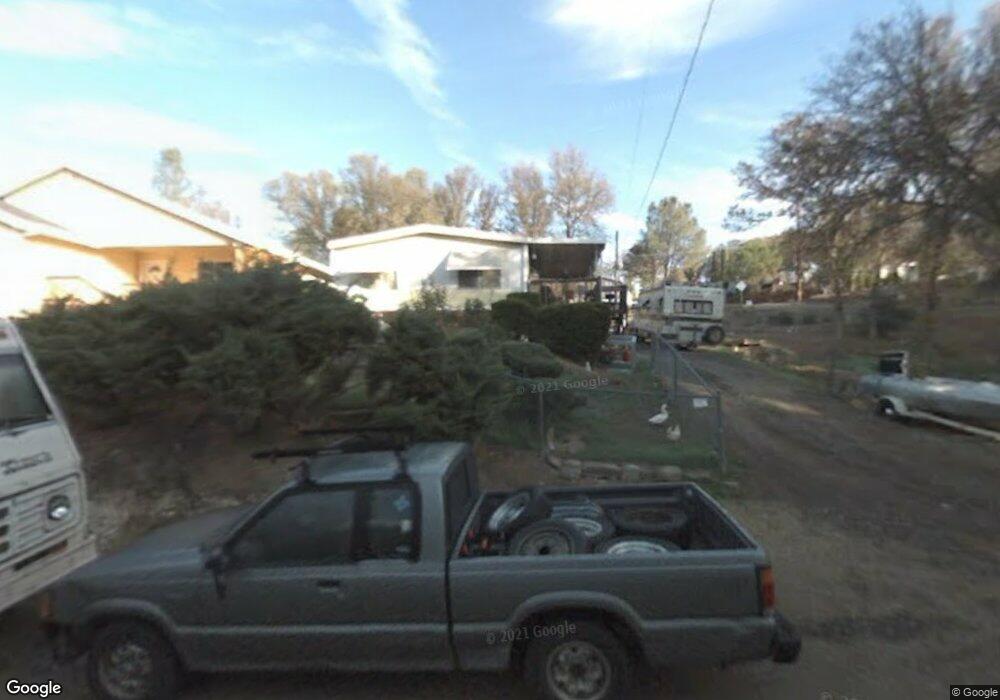
15888 19th Ave Clearlake, CA 95422
Estimated Value: $142,000 - $155,000
2
Beds
2
Baths
1,200
Sq Ft
$124/Sq Ft
Est. Value
About This Home
This home is located at 15888 19th Ave, Clearlake, CA 95422 and is currently estimated at $148,500, approximately $123 per square foot. 15888 19th Ave is a home located in Lake County with nearby schools including Lower Lake High School and Henderson Schoolhouse.
Ownership History
Date
Name
Owned For
Owner Type
Purchase Details
Closed on
May 24, 2010
Sold by
Exchange Bank
Bought by
Ira Services
Current Estimated Value
Purchase Details
Closed on
Nov 30, 2007
Sold by
Enterprise Homebuilders Inc
Bought by
Exchange Bank
Purchase Details
Closed on
Aug 14, 2007
Sold by
Enterprise Homebuilders Inc
Bought by
Grace & Roberts Investments Inc
Purchase Details
Closed on
Apr 24, 2006
Sold by
Lawson Charles A and Lawson Christine
Bought by
Enterprise Homebuilders Inc
Home Financials for this Owner
Home Financials are based on the most recent Mortgage that was taken out on this home.
Original Mortgage
$20,000
Interest Rate
6.29%
Mortgage Type
Stand Alone Second
Create a Home Valuation Report for This Property
The Home Valuation Report is an in-depth analysis detailing your home's value as well as a comparison with similar homes in the area
Home Values in the Area
Average Home Value in this Area
Purchase History
| Date | Buyer | Sale Price | Title Company |
|---|---|---|---|
| Ira Services | -- | None Available | |
| Exchange Bank | $50,000 | None Available | |
| Grace & Roberts Investments Inc | -- | None Available | |
| Enterprise Homebuilders Inc | $135,000 | Fidelity Natl Title Co Of Ca | |
| Lawson Charles A | -- | Fidelity Natl Title Co Of Ca |
Source: Public Records
Mortgage History
| Date | Status | Borrower | Loan Amount |
|---|---|---|---|
| Previous Owner | Lawson Charles A | $20,000 | |
| Previous Owner | Enterprise Homebuilders Inc | $110,000 |
Source: Public Records
Tax History Compared to Growth
Tax History
| Year | Tax Paid | Tax Assessment Tax Assessment Total Assessment is a certain percentage of the fair market value that is determined by local assessors to be the total taxable value of land and additions on the property. | Land | Improvement |
|---|---|---|---|---|
| 2025 | $824 | $59,218 | $32,184 | $27,034 |
| 2024 | $813 | $58,057 | $31,553 | $26,504 |
| 2023 | $801 | $56,920 | $30,935 | $25,985 |
| 2022 | $760 | $55,805 | $30,329 | $25,476 |
| 2021 | $770 | $54,712 | $29,735 | $24,977 |
| 2020 | $766 | $54,152 | $29,431 | $24,721 |
| 2019 | $735 | $53,091 | $28,854 | $24,237 |
| 2018 | $734 | $52,051 | $28,289 | $23,762 |
| 2017 | $701 | $51,032 | $27,735 | $23,297 |
| 2016 | $615 | $50,033 | $27,192 | $22,841 |
| 2015 | $674 | $49,282 | $26,784 | $22,498 |
| 2014 | $662 | $48,318 | $26,260 | $22,058 |
Source: Public Records
Map
Nearby Homes
- 16279 21st Ave
- 15702 21st Ave
- 15571 21st Ave
- 15879 20th Ave
- 15759 20th Ave
- 16291 16291 20th Ave
- 15660 20th Ave
- 15825 23rd Ave
- 16235 23rd Ave
- 15854 22nd Ave
- 16198 24th Ave
- 16163 24th Ave
- 15578 19th Ave
- 15628 19th Ave
- 16286 25th Ave
- 16276 25th Ave
- 16296 25th Ave
- 16162 19th Ave
- 16172 19th Ave
- 15563 22nd Ave