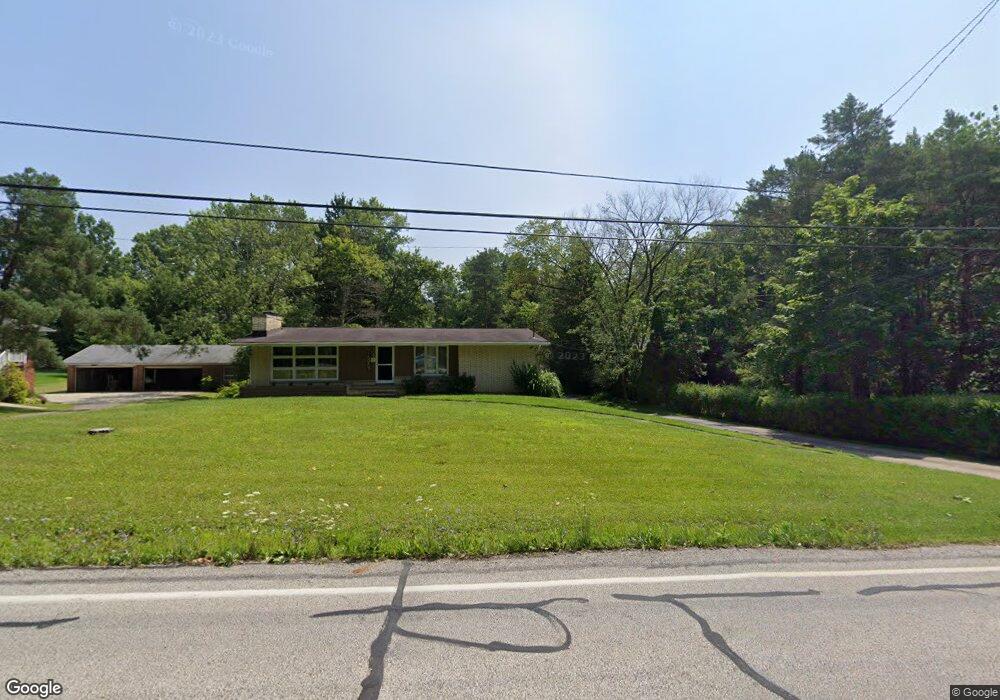
15953 York Rd North Royalton, OH 44133
Estimated Value: $240,495 - $287,000
3
Beds
3
Baths
900
Sq Ft
$305/Sq Ft
Est. Value
About This Home
This home is located at 15953 York Rd, North Royalton, OH 44133 and is currently estimated at $274,124, approximately $304 per square foot. 15953 York Rd is a home located in Cuyahoga County with nearby schools including North Royalton Middle School, North Royalton High School, and Royal Redeemer Lutheran School.
Ownership History
Date
Name
Owned For
Owner Type
Purchase Details
Closed on
Feb 5, 2014
Sold by
Check Robert A and Robert A Check Revocable Trust
Bought by
Check Robert A and Check Betty J
Current Estimated Value
Purchase Details
Closed on
Jan 4, 2006
Sold by
Pavlovicz Leonard P and Pavlovicz Andrea L
Bought by
Check Robert A and Nite Betty J
Home Financials for this Owner
Home Financials are based on the most recent Mortgage that was taken out on this home.
Original Mortgage
$120,000
Interest Rate
6.4%
Mortgage Type
Fannie Mae Freddie Mac
Purchase Details
Closed on
Jul 27, 1995
Sold by
Pavlovicz Robert J
Bought by
Pavlovicz Leonard and Pavlovicz Andrea
Home Financials for this Owner
Home Financials are based on the most recent Mortgage that was taken out on this home.
Original Mortgage
$75,000
Interest Rate
7.59%
Mortgage Type
New Conventional
Purchase Details
Closed on
Jan 1, 1975
Bought by
Pavlovicz Robert J
Create a Home Valuation Report for This Property
The Home Valuation Report is an in-depth analysis detailing your home's value as well as a comparison with similar homes in the area
Home Values in the Area
Average Home Value in this Area
Purchase History
| Date | Buyer | Sale Price | Title Company |
|---|---|---|---|
| Check Robert A | -- | None Available | |
| Check Robert A | -- | Attorney | |
| Check Robert A | $150,000 | Midland Title Security Inc | |
| Pavlovicz Leonard | $90,000 | -- | |
| Pavlovicz Robert J | -- | -- |
Source: Public Records
Mortgage History
| Date | Status | Borrower | Loan Amount |
|---|---|---|---|
| Closed | Check Robert A | $120,000 | |
| Closed | Pavlovicz Leonard | $75,000 |
Source: Public Records
Tax History Compared to Growth
Tax History
| Year | Tax Paid | Tax Assessment Tax Assessment Total Assessment is a certain percentage of the fair market value that is determined by local assessors to be the total taxable value of land and additions on the property. | Land | Improvement |
|---|---|---|---|---|
| 2024 | $4,378 | $73,745 | $9,835 | $63,910 |
| 2023 | $3,663 | $56,630 | $10,360 | $46,270 |
| 2022 | $3,639 | $56,630 | $10,360 | $46,270 |
| 2021 | $3,681 | $56,630 | $10,360 | $46,270 |
| 2020 | $3,255 | $47,600 | $8,720 | $38,890 |
| 2019 | $3,163 | $136,000 | $24,900 | $111,100 |
| 2018 | $3,053 | $47,600 | $8,720 | $38,890 |
| 2017 | $3,096 | $44,000 | $10,850 | $33,150 |
| 2016 | $2,907 | $44,000 | $10,850 | $33,150 |
| 2015 | $2,844 | $44,000 | $10,850 | $33,150 |
| 2014 | $2,844 | $42,710 | $10,540 | $32,170 |
Source: Public Records
Map
Nearby Homes
- 9447 Lindberg Dr
- 8381 N Akins Rd Unit H7
- 10281 River Run Ln
- 7400 Akins Rd
- 13831 Woodcroft Trace
- 10244 Hidden Valley Dr
- 11438 Drake Rd
- 11886 Friar Post
- 12906 Cartwright Pkwy
- 13000 Cartwright Pkwy
- 20842 Fawnhaven Dr
- S/L Margaret Dr
- 11861 W Edgerton Rd
- 7554 Margaret Dr
- 7595 Margaret Dr
- 7545 Margaret Dr
- 7585 Margaret Dr
- 7575 Margaret Dr
- 7535 Margaret Dr
- 7555 Margaret Dr
- 15941 York Rd
- 15965 York Rd
- 15929 York Rd
- 16130 York Rd
- 16142 York Rd
- 16154 York Rd
- 15917 York Rd
- 16240 Bennett Rd
- 9228 Lindberg Dr
- 16228 Bennett Rd
- 15905 York Rd
- 16208 York Rd
- 9288 Lindberg Dr
- 16216 Bennett Rd
- 16214 Bennett Rd
- 15893 York Rd
- 16257 Bennett Rd
- 16356 York Rd
- 15958 York Rd
- 16269 Bennett Rd