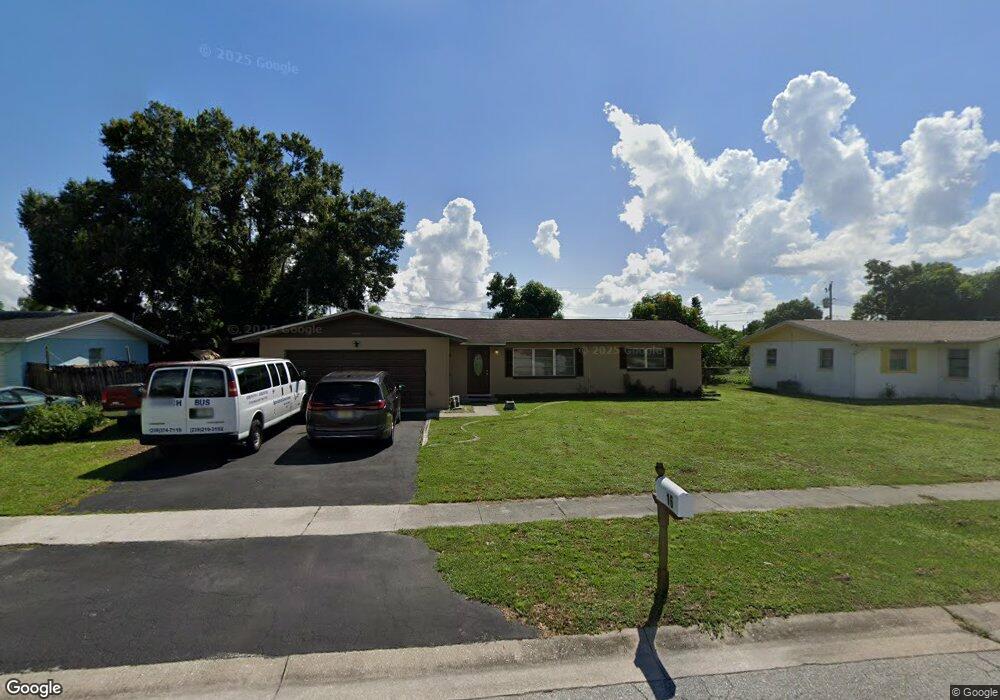
16 Broadway Cir Fort Myers, FL 33901
Estimated Value: $229,000 - $304,000
3
Beds
2
Baths
1,547
Sq Ft
$172/Sq Ft
Est. Value
About This Home
This home is located at 16 Broadway Cir, Fort Myers, FL 33901 and is currently estimated at $266,209, approximately $172 per square foot. 16 Broadway Cir is a home located in Lee County with nearby schools including Allen Park Elementary School, Orangewood Elementary School, and Edison Park Creative & Expressive Arts School.
Ownership History
Date
Name
Owned For
Owner Type
Purchase Details
Closed on
Mar 7, 2012
Sold by
Hamilton Property Partners Llc
Bought by
Uddin Jalal and Uddin Saida
Current Estimated Value
Purchase Details
Closed on
Jan 24, 2012
Sold by
Egalite Lyfete
Bought by
Hamilton Property Partners Llc
Purchase Details
Closed on
Feb 9, 2007
Sold by
Silverain Jean and Silverain Marie V
Bought by
Egalite Lyfete and Egalite Irlene M
Home Financials for this Owner
Home Financials are based on the most recent Mortgage that was taken out on this home.
Original Mortgage
$176,000
Interest Rate
8%
Mortgage Type
Unknown
Purchase Details
Closed on
Nov 15, 1994
Sold by
Gonzalez Fernando and Gonzalez Emma Del Pilar
Bought by
Silverain Jean and Silverain Marie V
Home Financials for this Owner
Home Financials are based on the most recent Mortgage that was taken out on this home.
Original Mortgage
$65,050
Interest Rate
8.84%
Create a Home Valuation Report for This Property
The Home Valuation Report is an in-depth analysis detailing your home's value as well as a comparison with similar homes in the area
Home Values in the Area
Average Home Value in this Area
Purchase History
| Date | Buyer | Sale Price | Title Company |
|---|---|---|---|
| Uddin Jalal | $46,500 | Gulfstream Title Llc | |
| Hamilton Property Partners Llc | $26,600 | None Available | |
| Egalite Lyfete | $220,000 | The Talon Group | |
| Silverain Jean | $68,500 | -- |
Source: Public Records
Mortgage History
| Date | Status | Borrower | Loan Amount |
|---|---|---|---|
| Previous Owner | Egalite Lyfete | $176,000 | |
| Previous Owner | Silverain Jean | $65,050 |
Source: Public Records
Tax History Compared to Growth
Tax History
| Year | Tax Paid | Tax Assessment Tax Assessment Total Assessment is a certain percentage of the fair market value that is determined by local assessors to be the total taxable value of land and additions on the property. | Land | Improvement |
|---|---|---|---|---|
| 2025 | $3,029 | $132,661 | -- | -- |
| 2024 | $3,048 | $120,601 | -- | -- |
| 2023 | $3,048 | $109,637 | $0 | $0 |
| 2022 | $2,719 | $99,670 | $0 | $0 |
| 2021 | $2,476 | $131,856 | $10,792 | $121,064 |
| 2020 | $2,254 | $119,510 | $8,100 | $111,410 |
| 2019 | $2,099 | $106,583 | $3,700 | $102,883 |
| 2018 | $1,978 | $95,288 | $3,700 | $91,588 |
| 2017 | $1,775 | $74,291 | $3,700 | $70,591 |
| 2016 | $1,678 | $70,519 | $4,464 | $66,055 |
| 2015 | $1,479 | $56,100 | $3,809 | $52,291 |
| 2014 | -- | $46,496 | $3,695 | $42,801 |
| 2013 | -- | $48,300 | $4,342 | $43,958 |
Source: Public Records
Map
Nearby Homes
- 13 Broadway Cir
- 2400 Hunter Terrace
- 2116 Pineview Rd
- 2431 Welch St
- 2105 Carrell Rd
- 2107 Unity Ave
- 3704 Broadway Unit 208
- 3704 Broadway Unit 318
- 3704 Broadway Unit 107
- 3704 Broadway Unit 305
- 3704 Broadway Unit 105
- 3704 Broadway Unit 101
- 3706 Broadway Unit 5
- 3706 Broadway Unit 40
- 3706 Broadway Unit 2
- 2121 Collier Ave Unit 401
- 2121 Collier Ave Unit 518
- 3266 Royal Palm Ave
- 2561 Parkway St
- 2123 Braman Ave
- 14 Broadway Cir
- 24 Broadway Cir
- 34 Broadway Cir
- 36 Broadway Cir
- 12 Broadway Cir
- 15 Broadway Cir
- 30 Broadway Cir
- 17 Broadway Cir
- 38 Broadway Cir
- 11 Broadway Cir
- 10 Broadway Cir
- 23 Broadway Cir
- 19 Broadway Cir
- 25 Broadway Cir
- 21 Broadway Cir
- 40 Broadway Cir
- 27 Broadway Cir
- 35 Broadway Cir
- 37 Broadway Cir
- 33 Broadway Cir