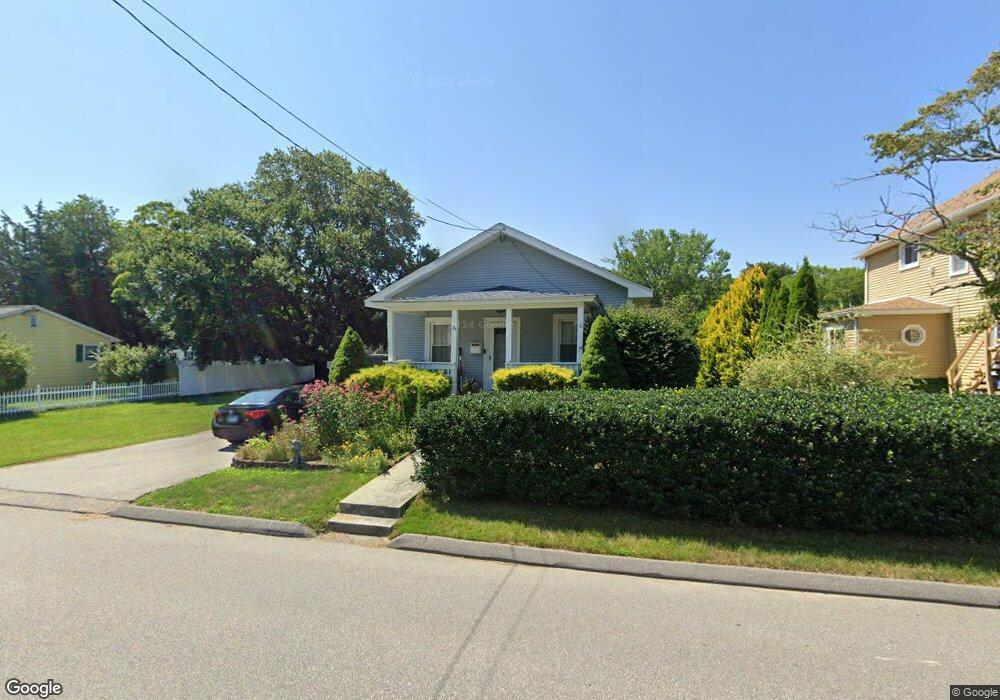
16 Quinebaug Rd Norwich, CT 06360
Central Norwich NeighborhoodEstimated Value: $199,000 - $254,175
3
Beds
1
Bath
912
Sq Ft
$252/Sq Ft
Est. Value
About This Home
This home is located at 16 Quinebaug Rd, Norwich, CT 06360 and is currently estimated at $229,794, approximately $251 per square foot. 16 Quinebaug Rd is a home located in New London County with nearby schools including Moriarty Magnet Elementary School, Kelly STEAM Magnet Middle School, and St. Joseph School.
Ownership History
Date
Name
Owned For
Owner Type
Purchase Details
Closed on
Oct 29, 1999
Sold by
Bradlaw William E
Bought by
Brown William G and Brown Lauren A
Current Estimated Value
Home Financials for this Owner
Home Financials are based on the most recent Mortgage that was taken out on this home.
Original Mortgage
$69,100
Interest Rate
7.78%
Create a Home Valuation Report for This Property
The Home Valuation Report is an in-depth analysis detailing your home's value as well as a comparison with similar homes in the area
Home Values in the Area
Average Home Value in this Area
Purchase History
| Date | Buyer | Sale Price | Title Company |
|---|---|---|---|
| Brown William G | $71,000 | -- | |
| Brown William G | $71,000 | -- |
Source: Public Records
Mortgage History
| Date | Status | Borrower | Loan Amount |
|---|---|---|---|
| Open | Brown William G | $123,399 | |
| Closed | Brown William G | $130,000 | |
| Closed | Brown William G | $127,450 | |
| Closed | Brown William G | $69,100 |
Source: Public Records
Tax History Compared to Growth
Tax History
| Year | Tax Paid | Tax Assessment Tax Assessment Total Assessment is a certain percentage of the fair market value that is determined by local assessors to be the total taxable value of land and additions on the property. | Land | Improvement |
|---|---|---|---|---|
| 2025 | $4,877 | $120,500 | $32,200 | $88,300 |
| 2024 | $4,603 | $120,500 | $32,200 | $88,300 |
| 2023 | $3,269 | $67,200 | $18,500 | $48,700 |
| 2022 | $3,258 | $67,200 | $18,500 | $48,700 |
| 2021 | $3,269 | $67,200 | $18,500 | $48,700 |
| 2020 | $3,262 | $67,300 | $18,600 | $48,700 |
| 2019 | $3,115 | $64,900 | $18,600 | $46,300 |
| 2018 | $2,739 | $56,600 | $15,100 | $41,500 |
| 2017 | $2,759 | $56,600 | $15,100 | $41,500 |
| 2016 | $2,777 | $56,600 | $15,100 | $41,500 |
| 2015 | $2,720 | $56,600 | $15,100 | $41,500 |
| 2014 | $2,600 | $56,600 | $15,100 | $41,500 |
Source: Public Records
Map
Nearby Homes
- 8 Quinebaug Rd
- 34 5th St
- 17 Sylvester St
- 607A Boswell Ave
- 36 Pratt St
- 556 Boswell Ave
- 29 Mckay St
- 406 Central Ave Unit 408
- 625 N Main St Unit 627
- 136 Hunters Rd Unit LOT 84
- 44 Norwich Ave Unit LOT 2
- 252 Prospect St Unit 254
- 6 Alexander St
- 303 Central Ave
- 207 Norwich Ave Unit 209
- 367 Boswell Ave
- 79 Roosevelt Ave
- 113 4th St
- 19 Laporte Dr
- 197 Central Ave
- 18 Quinebaug Rd
- 31 Saint Regis Ave
- 10 Quinebaug Rd
- 33 Saint Regis Ave
- 15 Quinebaug Rd
- 19 Quinebaug Rd
- 19 St Regis Ave
- 10 Hadley Ave
- 11 Quinebaug Rd
- 19 Saint Regis Ave
- 26 Hadley Ave
- 46 Saint Regis Ave
- 4 Hadley Ave
- 50 Saint Regis Ave
- 7 Quinebaug Rd
- 26 Quinebaug Rd
- 22 Russell Rd
- 36 St Regis Ave
- 34 Russell Rd
- 28 Saint Regis Ave