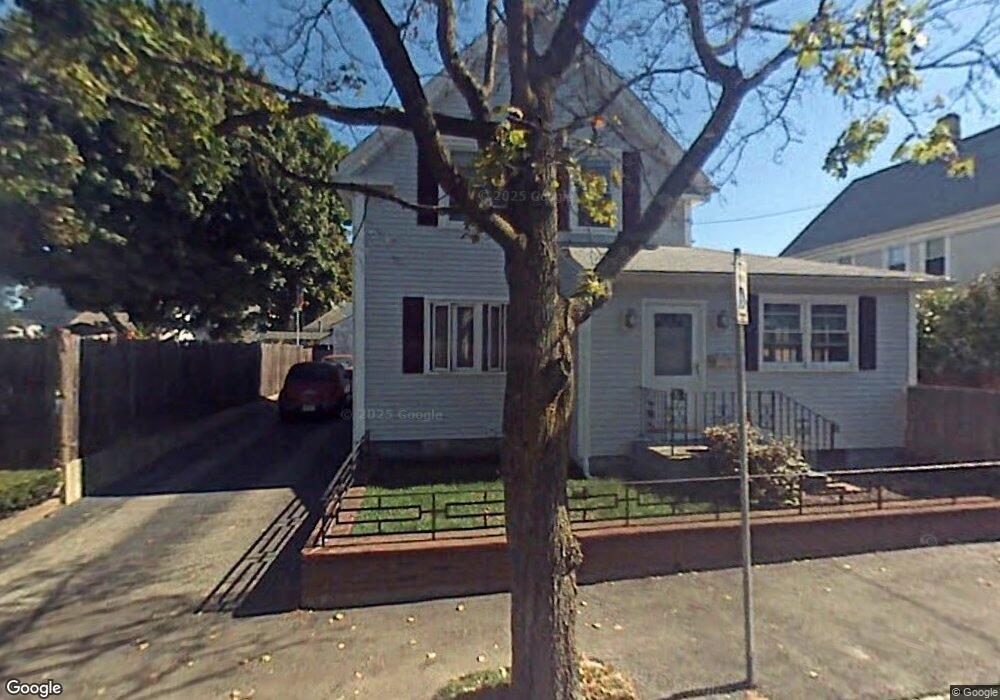
16 Rodman St Quincy, MA 02169
South Quincy NeighborhoodEstimated Value: $861,981 - $976,000
4
Beds
3
Baths
1,609
Sq Ft
$569/Sq Ft
Est. Value
About This Home
This home is located at 16 Rodman St, Quincy, MA 02169 and is currently estimated at $914,745, approximately $568 per square foot. 16 Rodman St is a home located in Norfolk County with nearby schools including South West Middle School, Lincoln-Hancock Community School, and Quincy High School.
Ownership History
Date
Name
Owned For
Owner Type
Purchase Details
Closed on
Nov 17, 2009
Sold by
Neely John R
Bought by
Ye Terrence
Current Estimated Value
Home Financials for this Owner
Home Financials are based on the most recent Mortgage that was taken out on this home.
Original Mortgage
$252,000
Interest Rate
4.98%
Mortgage Type
Purchase Money Mortgage
Purchase Details
Closed on
Oct 29, 2009
Sold by
Neely John R
Bought by
Ye Terrance and Lam Chingman
Home Financials for this Owner
Home Financials are based on the most recent Mortgage that was taken out on this home.
Original Mortgage
$252,000
Interest Rate
4.98%
Mortgage Type
Purchase Money Mortgage
Purchase Details
Closed on
Aug 31, 1998
Sold by
Predella Tr Jean M
Bought by
Canale Murray B and Canale Ann M
Create a Home Valuation Report for This Property
The Home Valuation Report is an in-depth analysis detailing your home's value as well as a comparison with similar homes in the area
Home Values in the Area
Average Home Value in this Area
Purchase History
| Date | Buyer | Sale Price | Title Company |
|---|---|---|---|
| Ye Terrence | -- | -- | |
| Ye Terrance | $315,000 | -- | |
| Canale Murray B | $44,000 | -- |
Source: Public Records
Mortgage History
| Date | Status | Borrower | Loan Amount |
|---|---|---|---|
| Closed | Canale Murray B | $227,592 | |
| Closed | Ye Terrence | $252,000 | |
| Closed | Ye Terrance | $252,000 | |
| Previous Owner | Canale Murray B | $145,000 |
Source: Public Records
Tax History Compared to Growth
Tax History
| Year | Tax Paid | Tax Assessment Tax Assessment Total Assessment is a certain percentage of the fair market value that is determined by local assessors to be the total taxable value of land and additions on the property. | Land | Improvement |
|---|---|---|---|---|
| 2025 | $8,886 | $770,700 | $277,800 | $492,900 |
| 2024 | $8,325 | $738,700 | $264,600 | $474,100 |
| 2023 | $7,673 | $689,400 | $240,500 | $448,900 |
| 2022 | $8,064 | $673,100 | $200,400 | $472,700 |
| 2021 | $7,510 | $618,600 | $200,400 | $418,200 |
| 2020 | $7,332 | $589,900 | $200,400 | $389,500 |
| 2019 | $7,197 | $573,500 | $189,100 | $384,400 |
| 2018 | $6,966 | $522,200 | $175,100 | $347,100 |
| 2017 | $6,911 | $487,700 | $166,800 | $320,900 |
| 2016 | $4,716 | $328,400 | $145,000 | $183,400 |
| 2015 | $4,577 | $313,500 | $145,000 | $168,500 |
| 2014 | $4,367 | $293,900 | $145,000 | $148,900 |
Source: Public Records
Map
Nearby Homes
- 56 Penn St Unit 4
- 347 Centre St
- 21 Totman St Unit 204
- 21 Totman St Unit 306
- 21 Totman St Unit 410
- 21 Totman St Unit 309
- 21 Totman St Unit Model-1
- 21 Totman St Unit 202
- 21 Totman St Unit 2
- 203 Centre St
- 72 Federal Ave
- 8 Jackson St Unit B2
- 192 Federal Ave Unit B
- 33 Brook Rd
- 64 Garfield St Unit B
- 195 Independence Ave Unit 137
- 218 Independence Ave Unit B
- 21 Arthur St
- 12 Arthur Ave
- 36 Greystone St Unit 36
- 20 Rodman St
- 10 Rodman St
- 23 Trafford St
- 17 Trafford St
- 27 Trafford St Unit 29
- 8 Rodman St
- 34 Taber St
- 36 Taber St Unit 36
- 36 Taber St
- 36 Taber St Unit 1
- 13 Rodman St
- 17 Rodman St
- 44 Taber St Unit 2
- 44 Taber St
- 42 Brooks Ave
- 11 Trafford St
- 26 Taber St
- 26 Taber St Unit 1
- 26 Taber St Unit 26
- 28 Taber St Unit 1