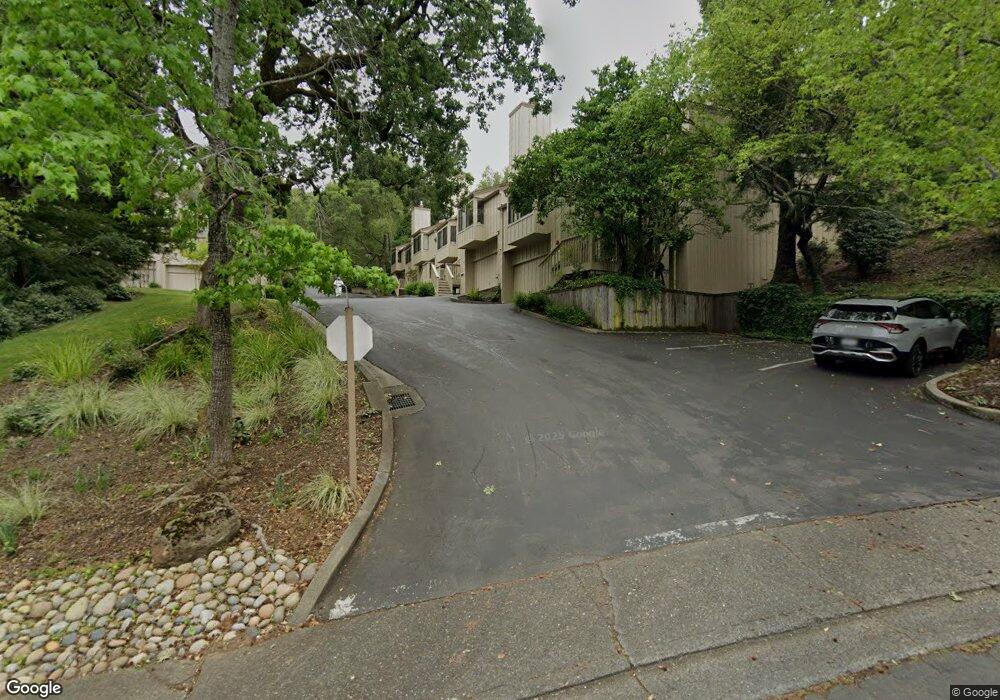
16 Sage Grouse Rd Novato, CA 94949
Ignacio NeighborhoodEstimated Value: $842,000 - $966,000
2
Beds
3
Baths
1,980
Sq Ft
$451/Sq Ft
Est. Value
About This Home
This home is located at 16 Sage Grouse Rd, Novato, CA 94949 and is currently estimated at $892,877, approximately $450 per square foot. 16 Sage Grouse Rd is a home located in Marin County with nearby schools including Loma Verde Elementary School, Novato High School, and Novato Charter School.
Ownership History
Date
Name
Owned For
Owner Type
Purchase Details
Closed on
Oct 15, 2019
Sold by
Baum Erica B
Bought by
Baum Erica B
Current Estimated Value
Purchase Details
Closed on
Sep 28, 2002
Sold by
Oosterbaan John
Bought by
Baum Erica B
Home Financials for this Owner
Home Financials are based on the most recent Mortgage that was taken out on this home.
Original Mortgage
$350,000
Outstanding Balance
$145,554
Interest Rate
6.05%
Estimated Equity
$747,323
Purchase Details
Closed on
Sep 7, 2001
Sold by
Gallagher Carol
Bought by
Gallagher Carol L
Purchase Details
Closed on
Aug 15, 2001
Sold by
Oosterbaan John Steven
Bought by
Oosterbaan John
Purchase Details
Closed on
Aug 1, 2000
Sold by
Ermisch Charles E and Ermisch Karen A A
Bought by
Gallagher Carol and Oosterbaan John Steven
Home Financials for this Owner
Home Financials are based on the most recent Mortgage that was taken out on this home.
Original Mortgage
$465,000
Interest Rate
8.19%
Mortgage Type
Stand Alone First
Create a Home Valuation Report for This Property
The Home Valuation Report is an in-depth analysis detailing your home's value as well as a comparison with similar homes in the area
Home Values in the Area
Average Home Value in this Area
Purchase History
| Date | Buyer | Sale Price | Title Company |
|---|---|---|---|
| Baum Erica B | -- | None Available | |
| Baum Erica B | $557,000 | California Land Title | |
| Gallagher Carol L | -- | -- | |
| Gallagher Carol L | -- | -- | |
| Oosterbaan John | -- | -- | |
| Gallagher Carol | $465,000 | California Land Title |
Source: Public Records
Mortgage History
| Date | Status | Borrower | Loan Amount |
|---|---|---|---|
| Open | Baum Erica B | $350,000 | |
| Previous Owner | Gallagher Carol | $465,000 |
Source: Public Records
Tax History Compared to Growth
Tax History
| Year | Tax Paid | Tax Assessment Tax Assessment Total Assessment is a certain percentage of the fair market value that is determined by local assessors to be the total taxable value of land and additions on the property. | Land | Improvement |
|---|---|---|---|---|
| 2025 | $9,994 | $816,212 | $321,500 | $494,712 |
| 2024 | $9,994 | $800,210 | $315,197 | $485,013 |
| 2023 | $9,811 | $784,525 | $309,019 | $475,506 |
| 2022 | $9,554 | $769,145 | $302,961 | $466,184 |
| 2021 | $9,804 | $754,067 | $297,022 | $457,045 |
| 2020 | $9,448 | $746,342 | $293,979 | $452,363 |
| 2019 | $9,661 | $731,709 | $288,215 | $443,494 |
| 2018 | $9,383 | $705,672 | $196,020 | $509,652 |
| 2017 | $8,630 | $641,520 | $178,200 | $463,320 |
| 2016 | $7,639 | $594,000 | $165,000 | $429,000 |
| 2015 | $6,804 | $540,000 | $150,000 | $390,000 |
| 2014 | $6,599 | $502,738 | $139,649 | $363,089 |
Source: Public Records
Map
Nearby Homes
- 16 Elegant Tern Rd
- 16 California Condor Way
- 53 Flicker Dr
- 230 Pelican Ln
- 19 Burdell Ct
- 11 Chapparal Ct
- 2901 Las Gallinas Ave
- 5 Charmaine Ct
- 10 Josefa Ct
- 154 Sandpiper Ct
- 2718 Las Gallinas Ave
- 19 Unionstone Dr
- 12 Eagle Gap Rd
- 71 Pacheco Creek Dr
- 9 Buckeye Ct
- 284 Blackstone Dr
- 2594 Las Gallinas Ave
- 64 Blackstone Dr
- 141 Roundtree Blvd
- 420 Quietwood Dr
- 20 Sage Grouse Rd
- 12 Sage Grouse Rd
- 8 Sage Grouse Rd
- 24 Sage Grouse Rd
- 4 Sage Grouse Rd
- 4 Elf Owl Ct
- 8 Elf Owl Ct
- 4 Elegant Tern Rd
- 12 Elf Owl Ct
- 16 Elf Owl Ct
- 12 Elegant Tern Rd
- 80 Flicker Dr
- 20 Elegant Tern Rd
- 76 Flicker Dr
- 89 Flicker Dr
- 24 Elegant Tern Rd
- 72 Flicker Dr
- 85 Flicker Dr
- 68 Flicker Dr
- 81 Flicker Dr