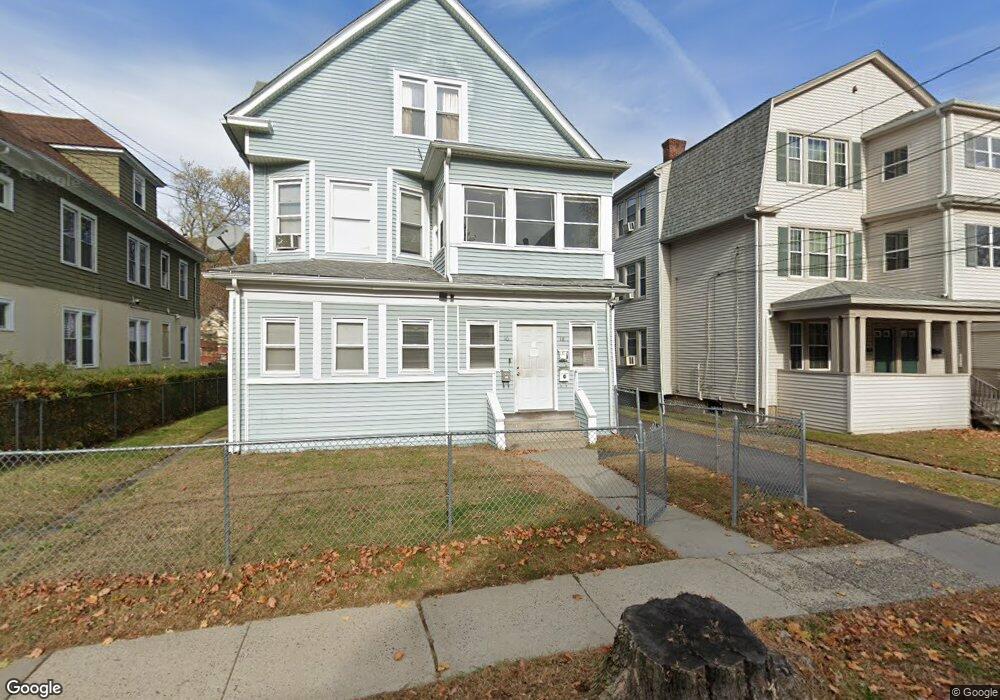
16 Winchester St Unit 18 Hartford, CT 06112
North End NeighborhoodEstimated Value: $216,744 - $423,000
6
Beds
3
Baths
4,077
Sq Ft
$79/Sq Ft
Est. Value
About This Home
This home is located at 16 Winchester St Unit 18, Hartford, CT 06112 and is currently estimated at $323,186, approximately $79 per square foot. 16 Winchester St Unit 18 is a home located in Hartford County with nearby schools including Capital Preparatory Magnet School, Perry Elementary School, and Ib Global Communications Academy.
Ownership History
Date
Name
Owned For
Owner Type
Purchase Details
Closed on
May 20, 2020
Sold by
Cook Purnell and Rodriguez Oscar
Bought by
Hill Alicia
Current Estimated Value
Purchase Details
Closed on
Aug 30, 2017
Sold by
Herrera Jhonny
Bought by
Cook Purnell and Rodriguez Oscar
Home Financials for this Owner
Home Financials are based on the most recent Mortgage that was taken out on this home.
Original Mortgage
$110,000
Interest Rate
3.91%
Mortgage Type
New Conventional
Purchase Details
Closed on
Jul 28, 2017
Sold by
Wilmington T Na
Bought by
Herrera Jhonny
Home Financials for this Owner
Home Financials are based on the most recent Mortgage that was taken out on this home.
Original Mortgage
$110,000
Interest Rate
3.91%
Mortgage Type
New Conventional
Purchase Details
Closed on
May 16, 2017
Sold by
Hill Alicia Y and Wilmington T Na
Bought by
Wilmington T Na
Purchase Details
Closed on
Nov 9, 2005
Sold by
Cooper Jewel and Lindo Wilbur
Bought by
Hill Alicia
Purchase Details
Closed on
Jan 5, 1999
Sold by
Gobourne Clarence and Gobourne Elsa
Bought by
Cooper Jewel and Lindo Wilburn
Create a Home Valuation Report for This Property
The Home Valuation Report is an in-depth analysis detailing your home's value as well as a comparison with similar homes in the area
Home Values in the Area
Average Home Value in this Area
Purchase History
| Date | Buyer | Sale Price | Title Company |
|---|---|---|---|
| Hill Alicia | -- | None Available | |
| Hill Alicia | -- | None Available | |
| Cook Purnell | $123,000 | -- | |
| Cook Purnell | $123,000 | -- | |
| Herrera Jhonny | $85,102 | -- | |
| Herrera Jhonny | $85,102 | -- | |
| Wilmington T Na | -- | -- | |
| Wilmington T Na | -- | -- | |
| Hill Alicia | $195,000 | -- | |
| Hill Alicia | $195,000 | -- | |
| Cooper Jewel | $77,000 | -- | |
| Cooper Jewel | $77,000 | -- |
Source: Public Records
Mortgage History
| Date | Status | Borrower | Loan Amount |
|---|---|---|---|
| Previous Owner | Cooper Jewel | $110,000 |
Source: Public Records
Tax History Compared to Growth
Tax History
| Year | Tax Paid | Tax Assessment Tax Assessment Total Assessment is a certain percentage of the fair market value that is determined by local assessors to be the total taxable value of land and additions on the property. | Land | Improvement |
|---|---|---|---|---|
| 2025 | $7,358 | $106,722 | $4,778 | $101,944 |
| 2024 | $7,358 | $106,722 | $4,778 | $101,944 |
| 2023 | $7,358 | $106,722 | $4,778 | $101,944 |
| 2022 | $7,359 | $106,723 | $4,778 | $101,945 |
| 2021 | $4,581 | $61,670 | $4,165 | $57,505 |
| 2020 | $4,581 | $61,670 | $4,165 | $57,505 |
| 2019 | $4,581 | $61,670 | $4,165 | $57,505 |
| 2018 | $4,427 | $59,591 | $4,025 | $55,566 |
| 2016 | $4,276 | $57,559 | $3,833 | $53,726 |
| 2015 | $4,073 | $54,825 | $3,651 | $51,174 |
| 2014 | $3,973 | $53,485 | $3,562 | $49,923 |
Source: Public Records
Map
Nearby Homes
- 275 Westland St
- 238 Enfield St Unit 240
- 158 Martin St Unit 160
- 50 Mansfield St
- 87 Mansfield St Unit 89
- 37 Martin St
- 147 Enfield St Unit 149
- 59 Mansfield St Unit 61
- 551 Garden St Unit 553
- 33 E Raymond St Unit 35
- 25 Judson St Unit C
- 142 Clark St
- 141 Greenfield St
- 67 Enfield St Unit 37
- 171 Edgewood St Unit 173
- 83 Colebrook St Unit 85
- 39 Capen St
- 102 Thomaston St Unit 104
- 183 Brook St Unit 185
- 186 Brook St Unit 188
- 12 Winchester St Unit 14
- 20 Winchester St Unit 22
- 360 Vine St Unit 362
- 15 Winchester St Unit 17
- 364 Vine St Unit 366
- 352 Vine St Unit 354
- 352 Vine St Unit 2nd Floor
- 24 Winchester St Unit 26
- 368 Vine St Unit 370
- 346 Vine St Unit 348
- 24-26 Winchester St
- 374 Vine St
- 23 Winchester St Unit 25
- 19 Winchester St Unit 21
- 342 Vine St Unit 344
- 28 Winchester St Unit 30
- 27-29 Winchester St
- 32 Winchester St Unit 34
- 27 Winchester St Unit 29
- 378 Vine St