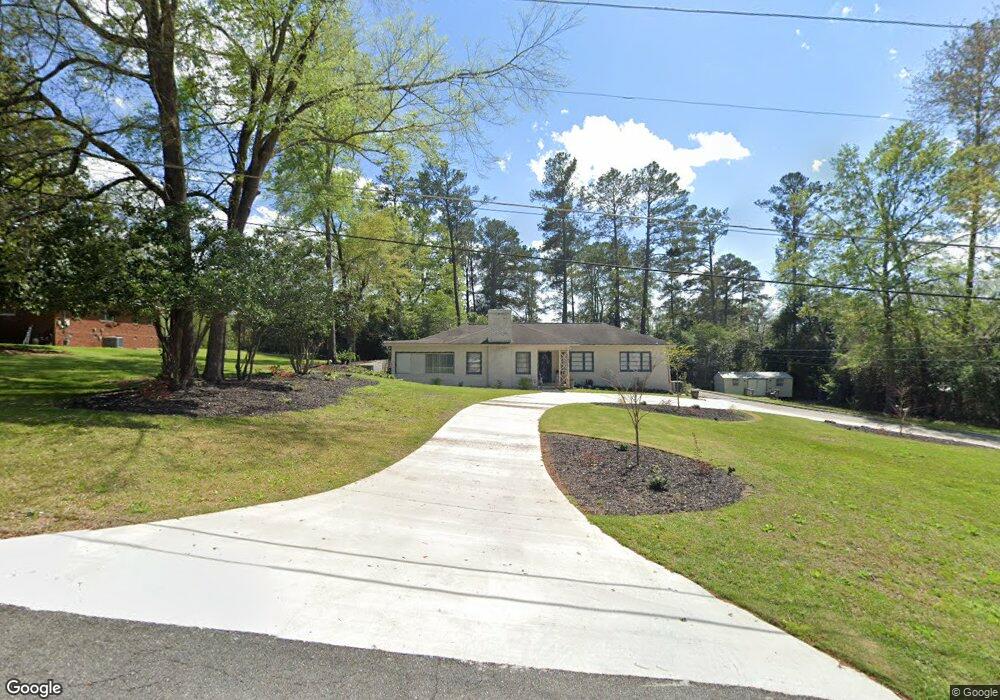
160 Woodland Cir Milledgeville, GA 31061
Estimated Value: $252,463 - $288,000
3
Beds
3
Baths
2,557
Sq Ft
$105/Sq Ft
Est. Value
About This Home
This home is located at 160 Woodland Cir, Milledgeville, GA 31061 and is currently estimated at $267,366, approximately $104 per square foot. 160 Woodland Cir is a home located in Baldwin County with nearby schools including Lakeview Primary, Lakeview Academy, and Oak Hill Middle School.
Ownership History
Date
Name
Owned For
Owner Type
Purchase Details
Closed on
Nov 5, 2020
Sold by
Jackson Eddie W
Bought by
Larkin Rechard Andres and Larkin Karen Adams
Current Estimated Value
Home Financials for this Owner
Home Financials are based on the most recent Mortgage that was taken out on this home.
Original Mortgage
$130,442
Outstanding Balance
$4,648
Interest Rate
2.8%
Mortgage Type
Commercial
Estimated Equity
$262,718
Purchase Details
Closed on
May 22, 2017
Sold by
Azzi Flutti Ann Marie
Bought by
Jackson Eddie W and Jackson Kristopher John
Home Financials for this Owner
Home Financials are based on the most recent Mortgage that was taken out on this home.
Original Mortgage
$71,356
Interest Rate
3.97%
Mortgage Type
Purchase Money Mortgage
Purchase Details
Closed on
May 16, 2016
Sold by
Azzi John G
Bought by
Flutti Ann M Azzi
Create a Home Valuation Report for This Property
The Home Valuation Report is an in-depth analysis detailing your home's value as well as a comparison with similar homes in the area
Home Values in the Area
Average Home Value in this Area
Purchase History
| Date | Buyer | Sale Price | Title Company |
|---|---|---|---|
| Larkin Rechard Andres | $157,000 | -- | |
| Jackson Eddie W | $70,000 | -- | |
| Flutti Ann M Azzi | -- | -- | |
| Azzi John G | -- | -- |
Source: Public Records
Mortgage History
| Date | Status | Borrower | Loan Amount |
|---|---|---|---|
| Open | Larkin Rechard Andres | $130,442 | |
| Previous Owner | Jackson Eddie W | $71,356 |
Source: Public Records
Tax History Compared to Growth
Tax History
| Year | Tax Paid | Tax Assessment Tax Assessment Total Assessment is a certain percentage of the fair market value that is determined by local assessors to be the total taxable value of land and additions on the property. | Land | Improvement |
|---|---|---|---|---|
| 2025 | $3,134 | $87,960 | $12,000 | $75,960 |
| 2024 | $3,134 | $87,960 | $12,000 | $75,960 |
| 2023 | $2,096 | $84,204 | $10,000 | $74,204 |
| 2022 | $2,120 | $85,948 | $10,000 | $75,948 |
| 2021 | $1,485 | $56,616 | $10,000 | $46,616 |
| 2020 | $1,411 | $54,520 | $10,000 | $44,520 |
| 2019 | $1,414 | $54,520 | $10,000 | $44,520 |
| 2018 | $746 | $54,520 | $10,000 | $44,520 |
| 2017 | $1,288 | $50,520 | $6,000 | $44,520 |
| 2016 | $998 | $47,080 | $6,200 | $40,880 |
| 2015 | $1,000 | $47,080 | $6,200 | $40,880 |
| 2014 | $1,002 | $47,080 | $6,200 | $40,880 |
Source: Public Records
Map
Nearby Homes
- 240 Lakeside Dr
- 261 Linda Dr NE
- 271 Lakeside Dr
- 1045 N Wilkinson St
- 1605 Stone Meadow Rd
- 1647 Valley Rd
- 384 Grimes Ave
- 1692 Pine Valley Rd
- 1050 N Clarke St
- 1010 N Clarke St
- 1508 N Columbia St
- 1756 Stone Meadow Rd
- 1740 Holly Hill Rd
- 130 Mill Way
- 1985 Briarcliff Rd
- 1985 Briarcliff Rd Unit A1
- 1985 Briarcliff Rd Unit B1
- 810 N Jackson St
- 757 N Columbia St
- 1835 Audobon Rd
- 170 Woodland Cir
- 156 Woodland Cir
- 1475 Forest Hill Dr
- 1475 Forest Hill Dr Unit 5/6
- 152 Woodland Cir
- 1471 Forest Hill Dr
- 1495 Forest Hill Dr
- 1491 Forest Hill Dr
- 171 Woodland Cir
- 181 Woodland Cir
- 190 Woodland Cir
- 0 Forest Hill Dr Unit 7420030
- 0 Forest Hill Dr Unit 8230161
- 0 Forest Hill Dr Unit 8354807
- 0 Forest Hill Dr Unit 8578391
- 0 Forest Hill Dr Unit 8733109
- 0 Forest Hill Dr Unit 29
- 161 Woodland Cir
- 1465 Forest Hill Dr
- 150 Woodland Cir