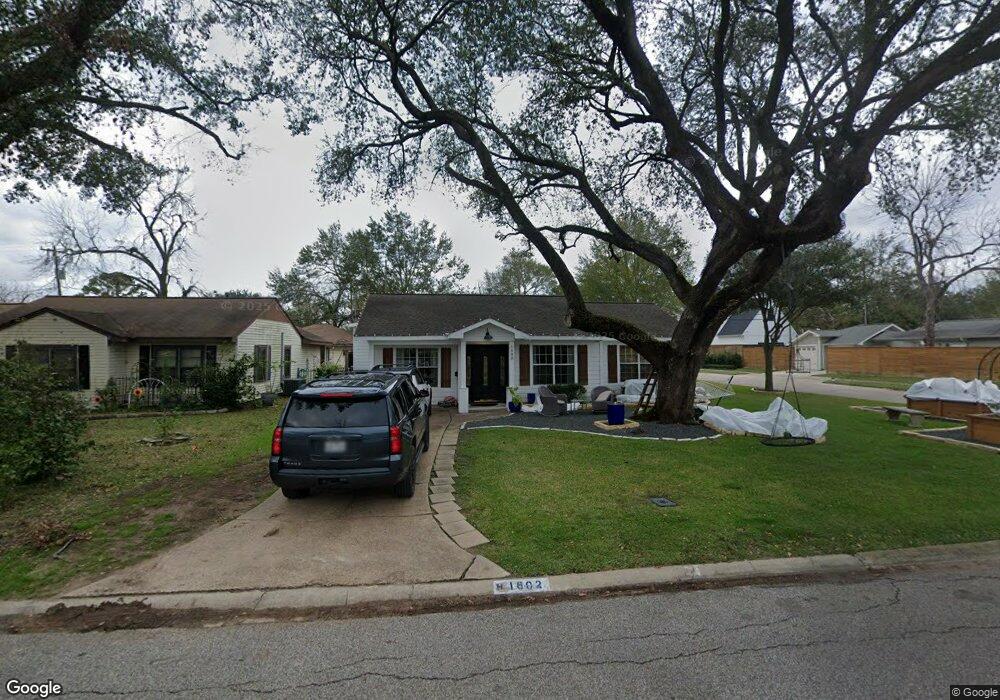
1602 Cheshire Ln Houston, TX 77018
Oak Forest-Garden Oaks NeighborhoodEstimated Value: $532,000 - $766,000
4
Beds
2
Baths
1,760
Sq Ft
$345/Sq Ft
Est. Value
About This Home
This home is located at 1602 Cheshire Ln, Houston, TX 77018 and is currently estimated at $607,599, approximately $345 per square foot. 1602 Cheshire Ln is a home located in Harris County with nearby schools including Stevens Elementary School, Frank Black Middle School, and Waltrip High School.
Ownership History
Date
Name
Owned For
Owner Type
Purchase Details
Closed on
Jul 31, 2014
Sold by
Devlin Dennis J and Devlin Nancy A
Bought by
Devlin Henry R
Current Estimated Value
Home Financials for this Owner
Home Financials are based on the most recent Mortgage that was taken out on this home.
Original Mortgage
$250,000
Outstanding Balance
$191,193
Interest Rate
4.19%
Mortgage Type
Purchase Money Mortgage
Estimated Equity
$416,406
Purchase Details
Closed on
Apr 15, 2013
Sold by
Mendez Abraham R and Mendez Consuelo M
Bought by
Devlin Dennis J and Devlin Nancy A
Purchase Details
Closed on
Jun 24, 1994
Sold by
Burns Dolores B
Bought by
Mendez Abraham R and Mendez Consuelo M
Home Financials for this Owner
Home Financials are based on the most recent Mortgage that was taken out on this home.
Original Mortgage
$53,675
Interest Rate
8.46%
Create a Home Valuation Report for This Property
The Home Valuation Report is an in-depth analysis detailing your home's value as well as a comparison with similar homes in the area
Home Values in the Area
Average Home Value in this Area
Purchase History
| Date | Buyer | Sale Price | Title Company |
|---|---|---|---|
| Devlin Henry R | -- | None Available | |
| Devlin Dennis J | -- | Startex Title Company | |
| Mendez Abraham R | -- | -- |
Source: Public Records
Mortgage History
| Date | Status | Borrower | Loan Amount |
|---|---|---|---|
| Open | Devlin Henry R | $250,000 | |
| Previous Owner | Mendez Abraham R | $53,675 |
Source: Public Records
Tax History Compared to Growth
Tax History
| Year | Tax Paid | Tax Assessment Tax Assessment Total Assessment is a certain percentage of the fair market value that is determined by local assessors to be the total taxable value of land and additions on the property. | Land | Improvement |
|---|---|---|---|---|
| 2025 | $7,035 | $454,724 | $390,260 | $64,464 |
| 2024 | $7,035 | $471,332 | $367,745 | $103,587 |
| 2023 | $7,035 | $455,865 | $367,745 | $88,120 |
| 2022 | $9,170 | $416,440 | $322,715 | $93,725 |
| 2021 | $9,455 | $405,680 | $300,200 | $105,480 |
| 2020 | $9,237 | $381,429 | $300,200 | $81,229 |
| 2019 | $9,652 | $381,429 | $300,200 | $81,229 |
| 2018 | $7,487 | $382,837 | $300,200 | $82,637 |
| 2017 | $9,680 | $382,837 | $300,200 | $82,637 |
| 2016 | $9,680 | $382,837 | $300,200 | $82,637 |
| 2015 | $8,337 | $382,837 | $300,200 | $82,637 |
| 2014 | $8,337 | $324,299 | $240,160 | $84,139 |
Source: Public Records
Map
Nearby Homes
- 1570 Cheshire Ln
- 1706 Hewitt Dr
- 1720 Libbey Dr
- 1730 Chantilly Ln
- 1506 W 43rd St
- 1721 Saxon Dr
- 1527 Thornton Rd
- 1522 Hewitt Dr
- 1514 Chantilly Ln
- 1734 Lamonte Ln
- 1515 Thornton Rd
- 1514 Gardenia Dr
- 1818 Nina Lee Ln
- 1623 Latexo Dr
- 1835 Cheshire Ln
- 1441 Chamboard Ln
- 1806 Gardenia Dr
- 1634 Latexo Dr
- 1435 Overhill St
- 1611 Richelieu Ln
- 1606 Cheshire Ln
- 1584 Cheshire Ln
- 1601 Hewitt Dr
- 1610 Cheshire Ln
- 1605 Hewitt Dr
- 1595 Hewitt Dr
- 1580 Cheshire Ln
- 1601 Cheshire Ln
- 1614 Cheshire Ln
- 1605 Cheshire Ln
- 1609 Hewitt Dr
- 1609 Cheshire Ln
- 1591 Hewitt Dr
- 1578 Cheshire Ln
- 1618 Cheshire Ln
- 1613 Hewitt Dr
- 1613 Cheshire Ln
- 1587 Hewitt Dr
- 1576 Cheshire Ln
- 1617 Cheshire Ln