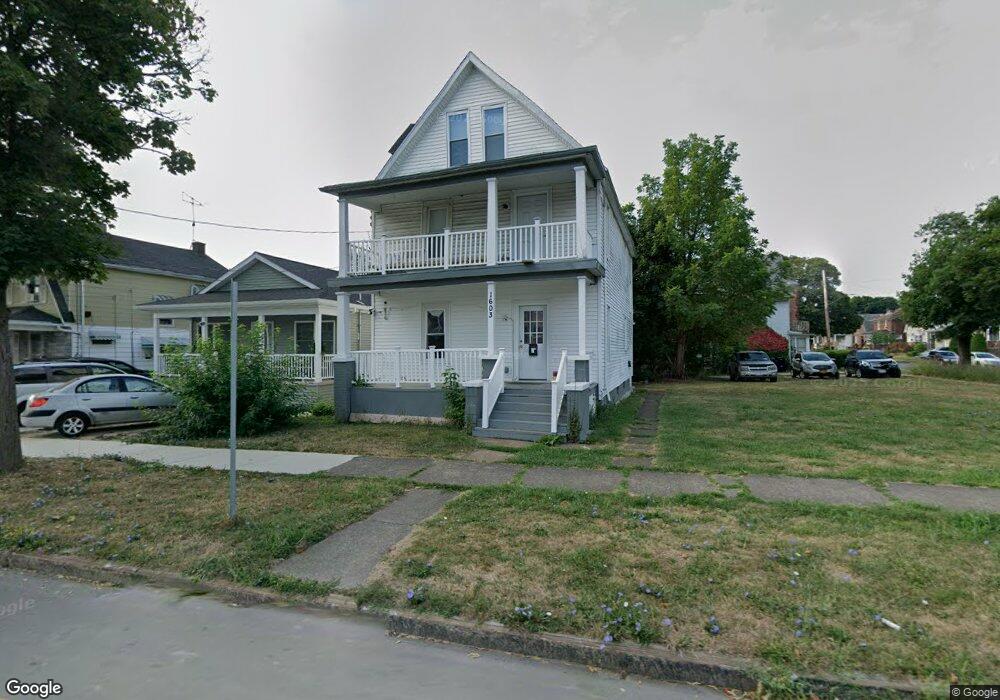
1603 Walnut Ave Niagara Falls, NY 14301
South End NeighborhoodEstimated Value: $101,771 - $146,000
4
Beds
2
Baths
1,672
Sq Ft
$75/Sq Ft
Est. Value
About This Home
This home is located at 1603 Walnut Ave, Niagara Falls, NY 14301 and is currently estimated at $125,443, approximately $75 per square foot. 1603 Walnut Ave is a home located in Niagara County with nearby schools including Niagara Falls High School and St. Joseph Elementary School.
Ownership History
Date
Name
Owned For
Owner Type
Purchase Details
Closed on
Jan 20, 2024
Sold by
Dusengimana Placide
Bought by
Hardware David L
Current Estimated Value
Purchase Details
Closed on
Mar 8, 2016
Sold by
City Of Niagara Falls New York
Bought by
Dusengimana Placide
Purchase Details
Closed on
Nov 9, 2005
Sold by
Capicotto Biagio
Bought by
1512 Holdings Inc
Purchase Details
Closed on
Oct 15, 2003
Sold by
Capicotta Nicola By Executor
Bought by
Capicotto Biagio
Create a Home Valuation Report for This Property
The Home Valuation Report is an in-depth analysis detailing your home's value as well as a comparison with similar homes in the area
Home Values in the Area
Average Home Value in this Area
Purchase History
| Date | Buyer | Sale Price | Title Company |
|---|---|---|---|
| Hardware David L | -- | None Listed On Document | |
| Dusengimana Placide | $10,000 | None Available | |
| 1512 Holdings Inc | $16,000 | Alan Roscetti | |
| Capicotto Biagio | -- | Edward Perman |
Source: Public Records
Tax History Compared to Growth
Tax History
| Year | Tax Paid | Tax Assessment Tax Assessment Total Assessment is a certain percentage of the fair market value that is determined by local assessors to be the total taxable value of land and additions on the property. | Land | Improvement |
|---|---|---|---|---|
| 2024 | $3,129 | $36,000 | $2,300 | $33,700 |
| 2023 | $2,398 | $36,000 | $2,300 | $33,700 |
| 2022 | $1,053 | $36,000 | $2,300 | $33,700 |
| 2021 | $1,053 | $36,000 | $2,300 | $33,700 |
| 2020 | $699 | $36,000 | $2,300 | $33,700 |
| 2019 | $1,314 | $36,000 | $2,300 | $33,700 |
| 2018 | $1,034 | $36,000 | $2,300 | $33,700 |
| 2017 | $1,314 | $36,000 | $2,300 | $33,700 |
| 2016 | $2,499 | $36,000 | $2,300 | $33,700 |
| 2015 | -- | $36,000 | $2,300 | $33,700 |
| 2014 | -- | $36,000 | $2,300 | $33,700 |
Source: Public Records
Map
Nearby Homes