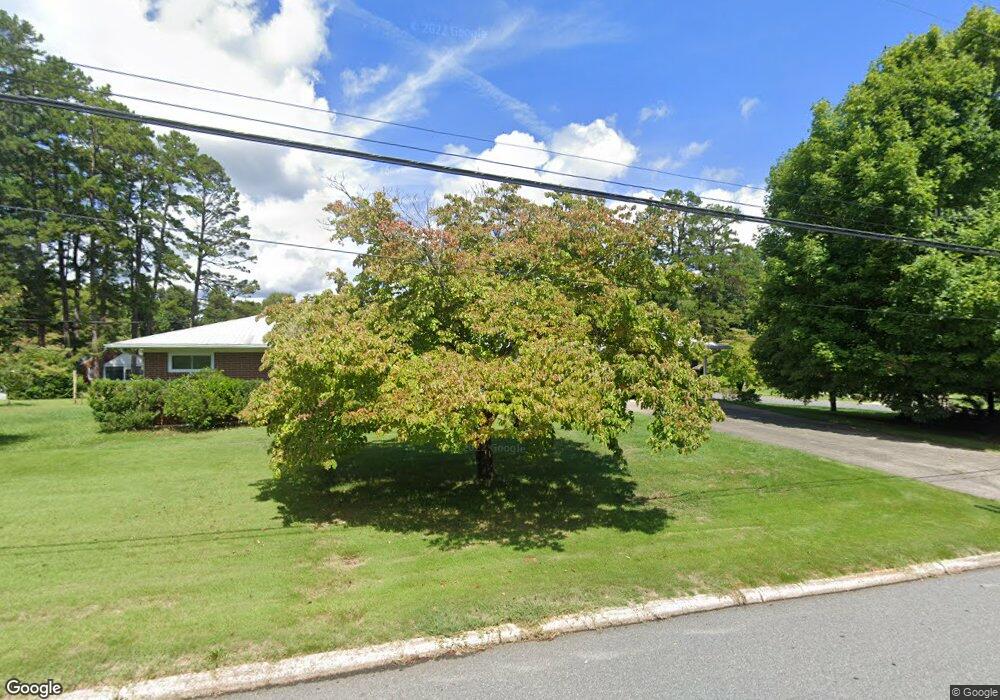
1604 Bellevue Rd Salisbury, NC 28144
Estimated Value: $296,000 - $365,034
4
Beds
2
Baths
3,273
Sq Ft
$99/Sq Ft
Est. Value
About This Home
This home is located at 1604 Bellevue Rd, Salisbury, NC 28144 and is currently estimated at $323,759, approximately $98 per square foot. 1604 Bellevue Rd is a home located in Rowan County with nearby schools including H D Isenberg Elementary, Knox Middle School, and North Rowan Middle School.
Ownership History
Date
Name
Owned For
Owner Type
Purchase Details
Closed on
Aug 3, 2017
Sold by
Moore Eric Lynn and Moore Marti Ann Miller
Bought by
Steelman Mark A and Steelman Rachel J
Current Estimated Value
Home Financials for this Owner
Home Financials are based on the most recent Mortgage that was taken out on this home.
Original Mortgage
$106,000
Outstanding Balance
$88,305
Interest Rate
3.9%
Mortgage Type
New Conventional
Estimated Equity
$235,454
Purchase Details
Closed on
Feb 26, 2014
Sold by
Moore Marti Ann Miller and Moore Eric Lynn
Bought by
Miller Linwood
Purchase Details
Closed on
Dec 16, 2010
Sold by
Miller Linwood and Moore Marti Ann Miller
Bought by
Moore Marti Ann Miller
Purchase Details
Closed on
Nov 14, 2007
Sold by
Nussman Jane E
Bought by
Bartlett Joseph J and Bartlett Linda B
Purchase Details
Closed on
Nov 6, 2007
Sold by
Miller Linwood and Moore Marti Ann Miller
Bought by
Nussman Jane E
Create a Home Valuation Report for This Property
The Home Valuation Report is an in-depth analysis detailing your home's value as well as a comparison with similar homes in the area
Home Values in the Area
Average Home Value in this Area
Purchase History
| Date | Buyer | Sale Price | Title Company |
|---|---|---|---|
| Steelman Mark A | $132,500 | None Available | |
| Miller Linwood | -- | None Available | |
| Moore Marti Ann Miller | -- | None Available | |
| Bartlett Joseph J | $98,000 | None Available | |
| Nussman Jane E | -- | None Available |
Source: Public Records
Mortgage History
| Date | Status | Borrower | Loan Amount |
|---|---|---|---|
| Open | Steelman Mark A | $106,000 |
Source: Public Records
Tax History Compared to Growth
Tax History
| Year | Tax Paid | Tax Assessment Tax Assessment Total Assessment is a certain percentage of the fair market value that is determined by local assessors to be the total taxable value of land and additions on the property. | Land | Improvement |
|---|---|---|---|---|
| 2025 | $3,314 | $277,049 | $50,250 | $226,799 |
| 2024 | $3,314 | $277,049 | $50,250 | $226,799 |
| 2023 | $3,314 | $277,049 | $50,250 | $226,799 |
| 2022 | $2,433 | $176,697 | $33,000 | $143,697 |
| 2021 | $2,433 | $176,697 | $33,000 | $143,697 |
| 2020 | $2,433 | $176,697 | $33,000 | $143,697 |
| 2019 | $2,433 | $176,697 | $33,000 | $143,697 |
| 2018 | $2,012 | $148,100 | $33,000 | $115,100 |
| 2017 | $2,002 | $148,100 | $33,000 | $115,100 |
| 2016 | $1,947 | $148,100 | $33,000 | $115,100 |
| 2015 | $1,959 | $148,100 | $33,000 | $115,100 |
| 2014 | $1,993 | $152,510 | $33,000 | $119,510 |
Source: Public Records
Map
Nearby Homes
- 207 N Milford Dr
- 1612 Statesville Blvd
- 306 N Milford Dr
- 305 N Milford Dr
- 319 N Milford Dr
- 401 Wellington Hills Cir
- 1441 Statesville Blvd
- 502 Wellington Hills Cir Unit 502
- 1317 Arden Dr
- 103 Spring Dr
- 1218 Forestdale Dr
- 1638 W Colonial Dr
- BEAUMONT Plan at Milford Terrace
- 1931 Calvin Ave
- 1937 Calvin Ave
- 523 Riviera Dr
- 109 Arabian Ln
- 1521 W Colonial Dr
- 519 Riviera Dr
- 285 Hannah Ave
- 211 N Milford Dr
- 1612 Bellevue Rd
- 1601 Bellevue Rd
- 208 N Milford Dr
- 215 N Milford Dr
- 1620 Bellevue Rd
- 210 N Milford Dr
- 0 Milford Dr Unit 2 3098696
- 221 N Milford Dr
- 214 N Milford Dr
- 1630 Bellevue Rd
- 222 N Milford Dr
- 123 N Milford Dr
- 201 N Milford Dr
- 1702 Bellevue Rd
- 119 N Milford Dr
- 230 N Milford Dr
- 1616 Statesville Blvd
- 1620 Statesville Blvd
- 109 Shamrock Dr