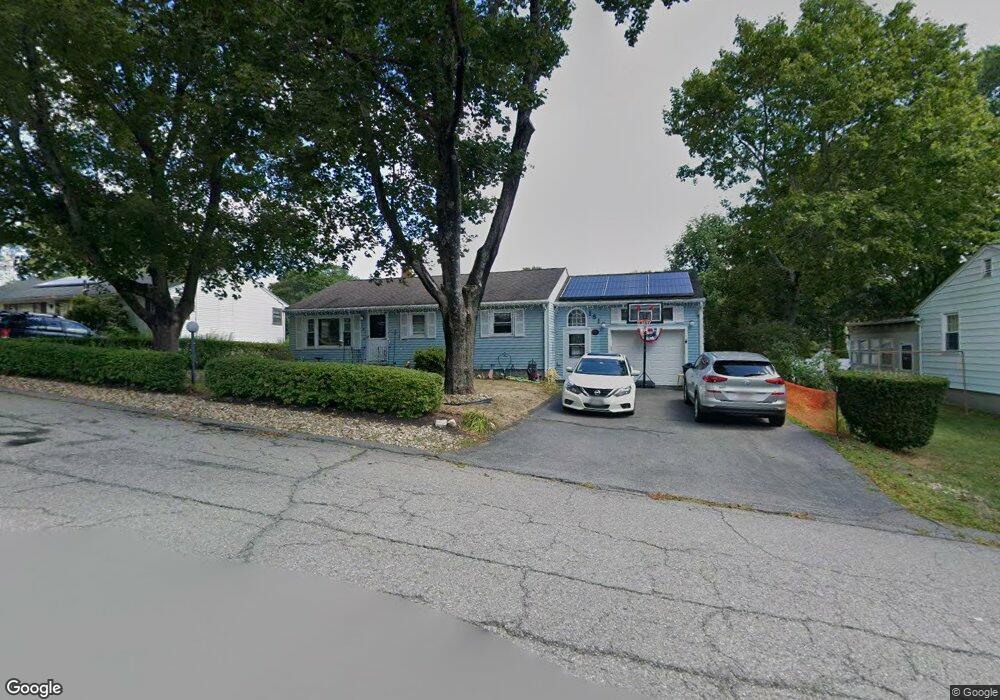
161 Sand St Gardner, MA 01440
Estimated Value: $340,000 - $369,748
3
Beds
3
Baths
988
Sq Ft
$356/Sq Ft
Est. Value
About This Home
This home is located at 161 Sand St, Gardner, MA 01440 and is currently estimated at $352,187, approximately $356 per square foot. 161 Sand St is a home located in Worcester County with nearby schools including Gardner High School and Holy Family Academy.
Ownership History
Date
Name
Owned For
Owner Type
Purchase Details
Closed on
Feb 27, 2019
Sold by
Sandra L Morin Ret and Morin
Bought by
Morin Stephanie M
Current Estimated Value
Home Financials for this Owner
Home Financials are based on the most recent Mortgage that was taken out on this home.
Original Mortgage
$169,750
Outstanding Balance
$148,632
Interest Rate
4.4%
Mortgage Type
New Conventional
Estimated Equity
$203,555
Purchase Details
Closed on
Sep 28, 2018
Sold by
Morin Sandra L
Bought by
Sandra L Morin Ret and Morin
Create a Home Valuation Report for This Property
The Home Valuation Report is an in-depth analysis detailing your home's value as well as a comparison with similar homes in the area
Home Values in the Area
Average Home Value in this Area
Purchase History
| Date | Buyer | Sale Price | Title Company |
|---|---|---|---|
| Morin Stephanie M | $175,000 | Adams & Assoc Legal Svcs Tit | |
| Morin Stephanie M | $175,000 | Adams & Assoc Legal Svcs Tit | |
| Sandra L Morin Ret | -- | -- | |
| Sandra L Morin Ret | -- | -- |
Source: Public Records
Mortgage History
| Date | Status | Borrower | Loan Amount |
|---|---|---|---|
| Open | Morin Stephanie M | $169,750 | |
| Closed | Morin Stephanie M | $169,750 |
Source: Public Records
Tax History Compared to Growth
Tax History
| Year | Tax Paid | Tax Assessment Tax Assessment Total Assessment is a certain percentage of the fair market value that is determined by local assessors to be the total taxable value of land and additions on the property. | Land | Improvement |
|---|---|---|---|---|
| 2025 | $45 | $312,700 | $67,000 | $245,700 |
| 2024 | $4,142 | $276,300 | $61,000 | $215,300 |
| 2023 | $4,149 | $257,200 | $60,100 | $197,100 |
| 2022 | $3,954 | $212,700 | $45,500 | $167,200 |
| 2021 | $3,860 | $192,600 | $39,500 | $153,100 |
| 2020 | $3,691 | $187,000 | $39,500 | $147,500 |
| 2019 | $3,482 | $172,900 | $39,500 | $133,400 |
| 2018 | $3,304 | $163,000 | $39,500 | $123,500 |
| 2017 | $3,125 | $152,600 | $39,500 | $113,100 |
| 2016 | $2,982 | $145,700 | $39,500 | $106,200 |
| 2015 | $2,803 | $140,300 | $39,500 | $100,800 |
| 2014 | $2,678 | $141,900 | $43,900 | $98,000 |
Source: Public Records
Map
Nearby Homes