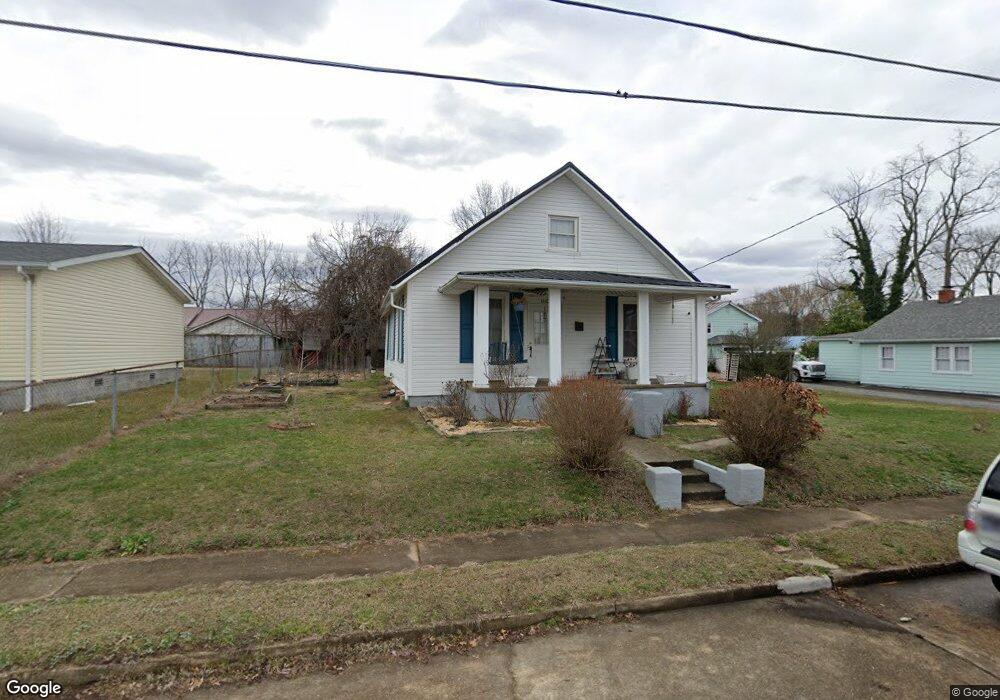
1610 Spring St Kingsport, TN 37664
Estimated Value: $160,000 - $240,000
3
Beds
2
Baths
1,518
Sq Ft
$130/Sq Ft
Est. Value
About This Home
This home is located at 1610 Spring St, Kingsport, TN 37664 and is currently estimated at $196,959, approximately $129 per square foot. 1610 Spring St is a home located in Sullivan County with nearby schools including Abraham Lincoln Elementary School, John Sevier Middle School, and Ross N. Robinson Middle School.
Ownership History
Date
Name
Owned For
Owner Type
Purchase Details
Closed on
Oct 27, 2009
Sold by
Wilson Charles D
Bought by
Hagy James Aaron
Current Estimated Value
Home Financials for this Owner
Home Financials are based on the most recent Mortgage that was taken out on this home.
Original Mortgage
$92,297
Outstanding Balance
$60,050
Interest Rate
4.93%
Estimated Equity
$136,909
Purchase Details
Closed on
Oct 26, 2009
Sold by
Johnson Robert Gayfield Ke
Bought by
Wilson Charles D
Home Financials for this Owner
Home Financials are based on the most recent Mortgage that was taken out on this home.
Original Mortgage
$92,297
Outstanding Balance
$60,050
Interest Rate
4.93%
Estimated Equity
$136,909
Purchase Details
Closed on
Feb 3, 2006
Sold by
Johnson Robert L
Bought by
Wilson Charles D
Purchase Details
Closed on
Dec 20, 2002
Sold by
Suzanne Johnson and Suzanne Paul
Bought by
Johnson Tonya M
Create a Home Valuation Report for This Property
The Home Valuation Report is an in-depth analysis detailing your home's value as well as a comparison with similar homes in the area
Home Values in the Area
Average Home Value in this Area
Purchase History
| Date | Buyer | Sale Price | Title Company |
|---|---|---|---|
| Hagy James Aaron | $94,000 | -- | |
| Wilson Charles D | -- | -- | |
| Wilson Charles D | -- | -- | |
| Johnson Tonya M | -- | -- |
Source: Public Records
Mortgage History
| Date | Status | Borrower | Loan Amount |
|---|---|---|---|
| Open | Johnson Tonya M | $92,297 | |
| Closed | Johnson Tonya M | $92,297 | |
| Previous Owner | Johnson Tonya M | $47,470 |
Source: Public Records
Tax History Compared to Growth
Tax History
| Year | Tax Paid | Tax Assessment Tax Assessment Total Assessment is a certain percentage of the fair market value that is determined by local assessors to be the total taxable value of land and additions on the property. | Land | Improvement |
|---|---|---|---|---|
| 2024 | -- | $23,425 | $6,675 | $16,750 |
| 2023 | $1,032 | $23,425 | $6,675 | $16,750 |
| 2022 | $1,032 | $23,425 | $6,675 | $16,750 |
| 2021 | $1,004 | $23,425 | $6,675 | $16,750 |
| 2020 | $551 | $23,425 | $6,675 | $16,750 |
| 2019 | $994 | $21,450 | $6,675 | $14,775 |
| 2018 | $971 | $21,450 | $6,675 | $14,775 |
| 2017 | $971 | $21,450 | $6,675 | $14,775 |
| 2016 | $728 | $15,675 | $3,025 | $12,650 |
| 2014 | $686 | $15,680 | $0 | $0 |
Source: Public Records
Map
Nearby Homes
- 1654 Pierce St
- 1725 Highland St
- 1706 Highland St
- 2492 Bridgeforth Crossing
- 1648 E St
- 1421 Linville St
- 1809 Autumn Ln
- 1585 Fort Henry Dr Unit P-D
- 1645 F St
- 1648 G St
- 2504 Overlook Rd
- 1400 E Stone Dr
- 2217 Ashwood Ave
- 2221 Ashwood Ave
- 1357 Watauga St
- 1557 Greenfield Ave
- 1312 Pineola Ave
- 2133 Stadium Dr
- 2177 Steadman St
- 1457 Garden Dr
- 1618 Spring St
- 1605 Desoto St
- 1606 Spring St
- 1622 Spring St
- 1602 Spring St
- 1622 Desoto St
- 1753 Harris St
- 1626 Desoto St
- 1609 Spring St
- 1613 Spring St
- 1630 Spring St
- 1617 Spring St
- 1753 Harris Ave
- 1800 Hilltop Dr
- 1804 Hilltop Dr
- 1621 Spring St
- 1629 Spring St
- 1521 Ardmore Place
- 1808 Hilltop Dr
- 1634 Spring St