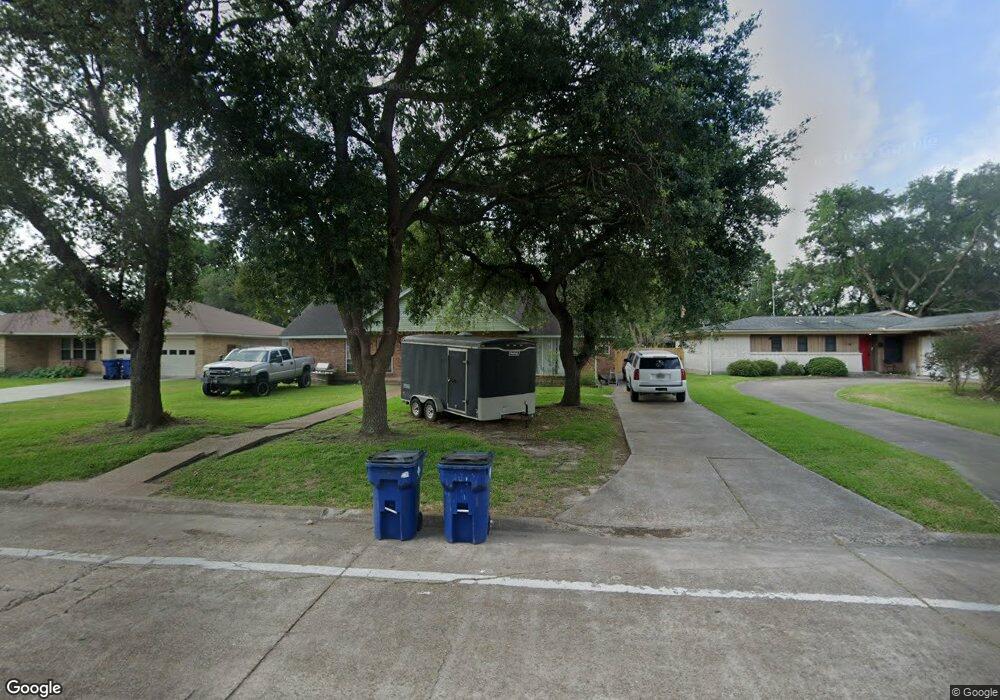
1613 19th Ave N Texas City, TX 77590
Westview NeighborhoodEstimated Value: $251,000 - $282,000
4
Beds
3
Baths
2,696
Sq Ft
$100/Sq Ft
Est. Value
About This Home
This home is located at 1613 19th Ave N, Texas City, TX 77590 and is currently estimated at $269,135, approximately $99 per square foot. 1613 19th Ave N is a home located in Galveston County with nearby schools including Northside Elementary School, Blocker Middle School, and Fry Intermediate School.
Ownership History
Date
Name
Owned For
Owner Type
Purchase Details
Closed on
Aug 17, 2011
Sold by
Kelley Royce L
Bought by
Mayeux Jeffery Lee and Mayeux Krystina M
Current Estimated Value
Home Financials for this Owner
Home Financials are based on the most recent Mortgage that was taken out on this home.
Original Mortgage
$130,956
Outstanding Balance
$91,010
Interest Rate
4.65%
Mortgage Type
VA
Estimated Equity
$178,125
Purchase Details
Closed on
Jul 28, 2000
Sold by
Ruby Lee Waggoner Testamentary Trust and Waggoner Robert L
Bought by
Kelley Royce L and Kelley Susan P
Home Financials for this Owner
Home Financials are based on the most recent Mortgage that was taken out on this home.
Original Mortgage
$55,000
Interest Rate
8.23%
Purchase Details
Closed on
Oct 3, 1997
Sold by
Waggoner George W
Bought by
Waggoner George W and George W Waggoner Revocable Living Trust
Create a Home Valuation Report for This Property
The Home Valuation Report is an in-depth analysis detailing your home's value as well as a comparison with similar homes in the area
Home Values in the Area
Average Home Value in this Area
Purchase History
| Date | Buyer | Sale Price | Title Company |
|---|---|---|---|
| Mayeux Jeffery Lee | -- | Stewart Title | |
| Kelley Royce L | -- | Stewart Title Company | |
| Waggoner George W | -- | -- |
Source: Public Records
Mortgage History
| Date | Status | Borrower | Loan Amount |
|---|---|---|---|
| Open | Mayeux Jeffery Lee | $130,956 | |
| Previous Owner | Kelley Royce L | $55,000 |
Source: Public Records
Tax History Compared to Growth
Tax History
| Year | Tax Paid | Tax Assessment Tax Assessment Total Assessment is a certain percentage of the fair market value that is determined by local assessors to be the total taxable value of land and additions on the property. | Land | Improvement |
|---|---|---|---|---|
| 2025 | $2,781 | $254,066 | -- | -- |
| 2024 | $2,781 | $230,969 | -- | -- |
| 2023 | $2,781 | $212,025 | $0 | $0 |
| 2022 | $4,713 | $192,750 | $0 | $0 |
| 2021 | $4,536 | $186,830 | $13,050 | $173,780 |
| 2020 | $4,259 | $163,540 | $13,050 | $150,490 |
| 2019 | $4,069 | $169,440 | $13,050 | $156,390 |
| 2018 | $3,661 | $131,650 | $13,050 | $118,600 |
| 2017 | $4,038 | $162,500 | $13,050 | $149,450 |
| 2016 | $3,591 | $144,610 | $13,050 | $131,560 |
| 2015 | $1,179 | $121,010 | $13,050 | $107,960 |
| 2014 | $1,189 | $121,010 | $13,050 | $107,960 |
Source: Public Records
Map
Nearby Homes
- 1705 20th Ave N
- 2414 17th St N
- 1708 17th Ave N
- 1801 18th Ave N
- 1523 19th Ave N
- 2018 17th St N
- 1813 22nd Ave N
- 1905 17th Ave N
- 517 17th Ave N
- 1909 16th Ave N
- 1601 15th St N
- 1429 17th Ave N
- 1822 23rd Ave N
- 0000 16th Ave N
- 1426 17th Ave N
- 1617 14th Ave N
- 1413 21st Ave N
- Concho Plan at Steed Landing
- Blanco Plan at Steed Landing
- Pedernales Plan at Steed Landing
- 1619 19th Ave N
- 1607 19th Ave N
- 1601 19th Ave N
- 1701 19th Ave N
- 1614 18th Ave N
- 1620 18th Ave N
- 1608 18th Ave N
- 1602 18th Ave N
- 1702 18th Ave N
- 1705 19th Ave N
- 1614 19th Ave N
- 1620 19th Ave N
- 1608 19th Ave N
- 1708 18th Ave N
- 1702 19th Ave N
- 1602 19th Ave N
- 1713 19th Ave N
- 1708 19th Ave N
- 1714 18th Ave N
- 1613 18th Ave N