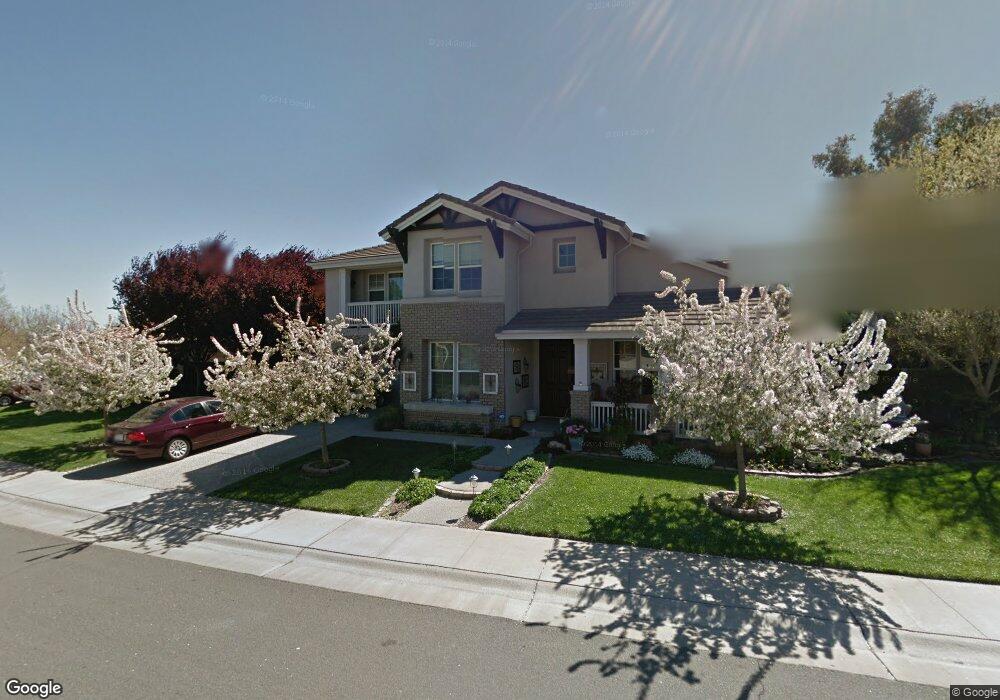
1620 Edgemore Ave Sacramento, CA 95835
Natomas Park NeighborhoodEstimated Value: $849,000 - $891,775
4
Beds
4
Baths
3,743
Sq Ft
$234/Sq Ft
Est. Value
About This Home
This home is located at 1620 Edgemore Ave, Sacramento, CA 95835 and is currently estimated at $876,194, approximately $234 per square foot. 1620 Edgemore Ave is a home located in Sacramento County with nearby schools including Natomas Park Elementary School, Natomas Middle School, and Inderkum High School.
Ownership History
Date
Name
Owned For
Owner Type
Purchase Details
Closed on
Jun 17, 2021
Sold by
Pierce Susan Marcia and Pierce Timothy Lee
Bought by
Hustead Amber L and Hustead Aaron M
Current Estimated Value
Home Financials for this Owner
Home Financials are based on the most recent Mortgage that was taken out on this home.
Original Mortgage
$796,681
Outstanding Balance
$721,295
Interest Rate
2.9%
Mortgage Type
VA
Estimated Equity
$154,899
Purchase Details
Closed on
Jun 22, 2009
Sold by
Pierce Tim L and Pierce Susan
Bought by
Pierce Susan Marcia and Pierce Timothy Lee
Purchase Details
Closed on
Jul 7, 2003
Sold by
Lennar Renaissance Inc
Bought by
Pierce Tim L and Pierce Susan
Home Financials for this Owner
Home Financials are based on the most recent Mortgage that was taken out on this home.
Original Mortgage
$317,250
Interest Rate
5.18%
Mortgage Type
Purchase Money Mortgage
Create a Home Valuation Report for This Property
The Home Valuation Report is an in-depth analysis detailing your home's value as well as a comparison with similar homes in the area
Home Values in the Area
Average Home Value in this Area
Purchase History
| Date | Buyer | Sale Price | Title Company |
|---|---|---|---|
| Hustead Amber L | $825,000 | Placer Title Company | |
| Pierce Susan Marcia | -- | None Available | |
| Pierce Tim L | $397,000 | North American Title Company |
Source: Public Records
Mortgage History
| Date | Status | Borrower | Loan Amount |
|---|---|---|---|
| Open | Hustead Amber L | $796,681 | |
| Previous Owner | Pierce Tim L | $317,250 | |
| Closed | Pierce Tim L | $39,600 |
Source: Public Records
Tax History Compared to Growth
Tax History
| Year | Tax Paid | Tax Assessment Tax Assessment Total Assessment is a certain percentage of the fair market value that is determined by local assessors to be the total taxable value of land and additions on the property. | Land | Improvement |
|---|---|---|---|---|
| 2025 | $12,134 | $893,005 | $216,485 | $676,520 |
| 2024 | $12,134 | $875,496 | $212,241 | $663,255 |
| 2023 | $11,560 | $858,330 | $208,080 | $650,250 |
| 2022 | $11,389 | $841,500 | $204,000 | $637,500 |
| 2021 | $8,207 | $565,455 | $105,073 | $460,382 |
| 2020 | $8,199 | $559,658 | $103,996 | $455,662 |
| 2019 | $8,080 | $548,685 | $101,957 | $446,728 |
| 2018 | $7,792 | $537,927 | $99,958 | $437,969 |
| 2017 | $7,584 | $527,381 | $97,999 | $429,382 |
| 2016 | $7,009 | $475,792 | $88,413 | $387,379 |
| 2015 | $6,631 | $453,136 | $84,203 | $368,933 |
| 2014 | $6,144 | $431,558 | $80,193 | $351,365 |
Source: Public Records
Map
Nearby Homes
- 4860 Blackrock Dr
- 1701 Baines Ave
- 1760 Montara Ave
- 1469 Mayfield St
- 1840 Montara Ave
- Plan 3506 at Natomas Landing - The Cottages
- Plan 3504 at Natomas Landing - The Cottages
- Plan 3502 at Natomas Landing - The Cottages
- Plan 3505 at Natomas Landing - The Cottages
- Plan 4001 at Natomas Landing - The Chateaus
- Plan 4002 at Natomas Landing - The Chateaus
- Plan 4503 at Natomas Landing - The Bungalows
- Plan 4005 at Natomas Landing - The Chateaus
- Plan 4502 at Natomas Landing - The Bungalows
- Plan 4504 at Natomas Landing - The Bungalows
- Plan 4003 at Natomas Landing - The Chateaus
- 1468 Jeannie Way
- 1472 Jeannie Way
- 1476 Jeannie Way
- 1480 Jeannie Way
- 1600 Edgemore Ave
- 4820 Blackrock Dr
- 4810 Blackrock Dr
- 4800 Blackrock Dr
- 1621 Edgemore Ave
- 1631 Edgemore Ave
- 1611 Edgemore Ave
- 4840 Blackrock Dr
- 1601 Edgemore Ave
- 1571 Arrowbrook Ave
- 1570 Edgemore Ave
- 1700 Edgemore Ave
- 4850 Blackrock Dr
- 1620 Baines Ave
- 1701 N Bend Dr
- 1630 Baines Ave
- 1610 Baines Ave
- 1640 Baines Ave
- 1571 Edgemore Ave
- 1600 Baines Ave