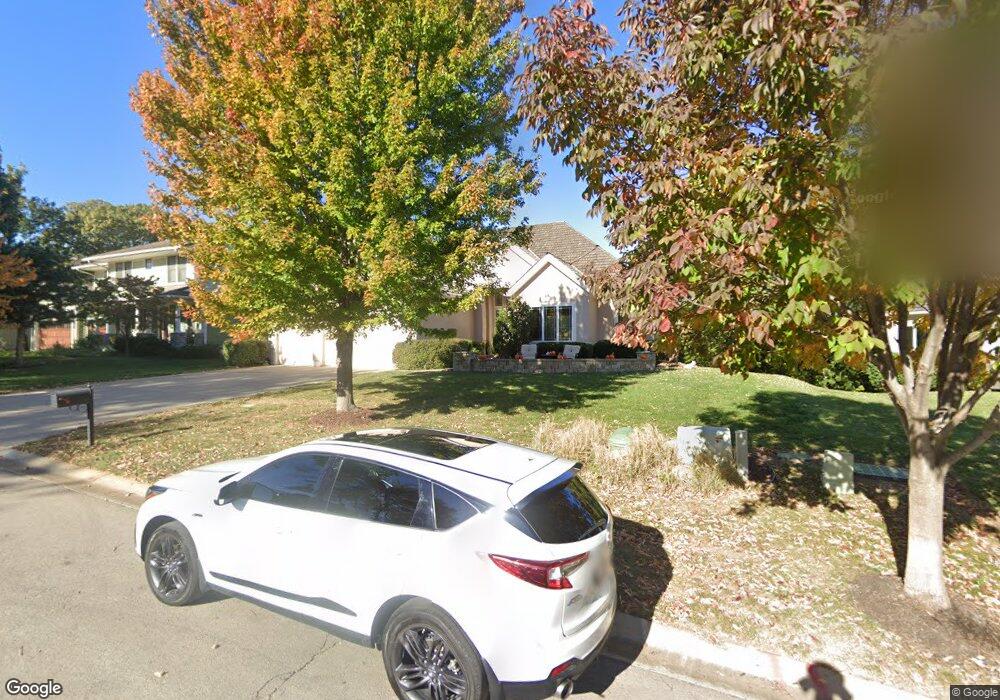
16202 Canterbury Rd Stilwell, KS 66085
Estimated Value: $629,942 - $791,000
4
Beds
3
Baths
2,142
Sq Ft
$333/Sq Ft
Est. Value
About This Home
This home is located at 16202 Canterbury Rd, Stilwell, KS 66085 and is currently estimated at $712,736, approximately $332 per square foot. 16202 Canterbury Rd is a home located in Johnson County with nearby schools including Blue River Elementary School, Blue Valley Middle School, and Blue Valley High School.
Ownership History
Date
Name
Owned For
Owner Type
Purchase Details
Closed on
Jun 21, 2021
Sold by
Brown Stephen E and Brown Susan
Bought by
Brown Stephen E and Brown Susan M
Current Estimated Value
Purchase Details
Closed on
Jun 6, 2005
Sold by
Jack Southerland Custom Homes Inc
Bought by
Brown Stephen E and Brown Susan
Home Financials for this Owner
Home Financials are based on the most recent Mortgage that was taken out on this home.
Original Mortgage
$345,000
Outstanding Balance
$180,111
Interest Rate
5.76%
Mortgage Type
New Conventional
Estimated Equity
$532,625
Purchase Details
Closed on
Feb 26, 2004
Sold by
Wrs Inc
Bought by
Jack Southerland Custom Homes Inc
Home Financials for this Owner
Home Financials are based on the most recent Mortgage that was taken out on this home.
Original Mortgage
$453,050
Interest Rate
5.67%
Mortgage Type
Construction
Create a Home Valuation Report for This Property
The Home Valuation Report is an in-depth analysis detailing your home's value as well as a comparison with similar homes in the area
Home Values in the Area
Average Home Value in this Area
Purchase History
| Date | Buyer | Sale Price | Title Company |
|---|---|---|---|
| Brown Stephen E | -- | None Available | |
| Brown Stephen E | -- | Columbia Title Of Johnson | |
| Jack Southerland Custom Homes Inc | -- | Columbian Title Of Johnson C |
Source: Public Records
Mortgage History
| Date | Status | Borrower | Loan Amount |
|---|---|---|---|
| Open | Brown Stephen E | $345,000 | |
| Previous Owner | Jack Southerland Custom Homes Inc | $453,050 |
Source: Public Records
Tax History Compared to Growth
Tax History
| Year | Tax Paid | Tax Assessment Tax Assessment Total Assessment is a certain percentage of the fair market value that is determined by local assessors to be the total taxable value of land and additions on the property. | Land | Improvement |
|---|---|---|---|---|
| 2024 | $7,293 | $70,782 | $15,197 | $55,585 |
| 2023 | $7,812 | $74,462 | $13,219 | $61,243 |
| 2022 | $7,453 | $69,437 | $13,219 | $56,218 |
| 2021 | $7,319 | $64,411 | $12,023 | $52,388 |
| 2020 | $6,844 | $59,087 | $10,007 | $49,080 |
| 2019 | $6,844 | $57,604 | $9,542 | $48,062 |
| 2018 | $7,759 | $71,692 | $16,733 | $54,959 |
| 2017 | $7,695 | $62,204 | $14,565 | $47,639 |
| 2016 | $7,084 | $57,201 | $14,565 | $42,636 |
| 2015 | $6,844 | $54,568 | $14,565 | $40,003 |
| 2013 | -- | $55,511 | $14,565 | $40,946 |
Source: Public Records
Map
Nearby Homes
- 16140 Canterbury Rd
- 2628 W 162nd Terrace
- 15801 Canterbury St
- 18605 Reinhardt St
- 18612 Reinhardt St
- 18452 Pawnee Ln
- 18505 Pawnee Ln
- 18509 Pawnee Ln
- 18460 Pawnee Ln
- 18456 Pawnee Ln
- 3811 W 158th Terrace
- 3806 W 158th Terrace
- 18464 Windsor St
- 18465 Windsor St
- 15812 Howe St
- 15825 Howe St
- 159th Mission Rd
- 3301 W 157th St
- 15704 Chadwick St
- 16201 Spyglass Ct
- 16210 Canterbury Rd
- 16198 Canterbury Rd
- 16218 Canterbury Rd
- 16186 Canterbury Rd
- 16195 Canterbury Rd
- 16226 Canterbury Rd
- 16209 Canterbury Rd
- 16174 Canterbury Rd
- 16210 Belinder Rd
- 2910 W 162nd St
- 16227 Canterbury Rd
- 16165 Canterbury Rd
- 16160 Canterbury Rd
- 16234 Canterbury Rd
- 16224 Belinder Rd
- 16125 Kranker Dr
- 2880 W 162nd St
- 16243 Canterbury Rd
- 16242 Canterbury Rd
- 16155 Canterbury Rd