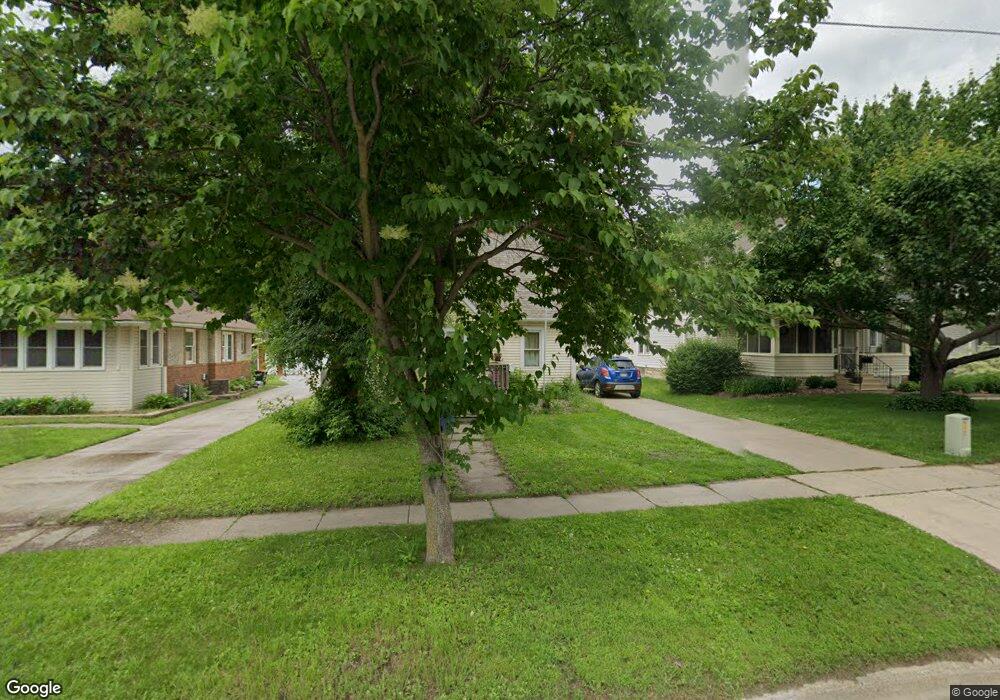
1621 Bush St Red Wing, MN 55066
Estimated Value: $203,546 - $245,000
3
Beds
1
Bath
984
Sq Ft
$222/Sq Ft
Est. Value
About This Home
This home is located at 1621 Bush St, Red Wing, MN 55066 and is currently estimated at $218,637, approximately $222 per square foot. 1621 Bush St is a home located in Goodhue County with nearby schools including Sunnyside Elementary School, Burnside Elementary School, and Twin Bluff Middle School.
Ownership History
Date
Name
Owned For
Owner Type
Purchase Details
Closed on
Aug 20, 2015
Sold by
Skogley Gerald M and Skogley Marilyn B
Bought by
Kafka Cassandra R
Current Estimated Value
Purchase Details
Closed on
Dec 3, 2014
Sold by
Kroll Karen J
Bought by
Skogley Gerald M and Skogley Marilyn B
Purchase Details
Closed on
May 23, 2008
Sold by
Skagley Marilyn B and Skagley Gerald M
Bought by
Kroll Karen J
Purchase Details
Closed on
Jul 7, 1998
Sold by
Kreye Thomas J and Kreye Beverly L
Bought by
Skogles Marilyn B
Create a Home Valuation Report for This Property
The Home Valuation Report is an in-depth analysis detailing your home's value as well as a comparison with similar homes in the area
Home Values in the Area
Average Home Value in this Area
Purchase History
| Date | Buyer | Sale Price | Title Company |
|---|---|---|---|
| Kafka Cassandra R | $100,000 | Goodhue County Abstract | |
| Skogley Gerald M | -- | None Available | |
| Kroll Karen J | $80,000 | -- | |
| Skogles Marilyn B | $80,000 | -- | |
| Skogley Marilyn B | $79,900 | -- |
Source: Public Records
Mortgage History
| Date | Status | Borrower | Loan Amount |
|---|---|---|---|
| Closed | Skogles Marilyn B | -- |
Source: Public Records
Tax History Compared to Growth
Tax History
| Year | Tax Paid | Tax Assessment Tax Assessment Total Assessment is a certain percentage of the fair market value that is determined by local assessors to be the total taxable value of land and additions on the property. | Land | Improvement |
|---|---|---|---|---|
| 2025 | -- | $166,500 | $30,200 | $136,300 |
| 2024 | -- | $164,100 | $30,200 | $133,900 |
| 2023 | $3,162 | $154,400 | $30,200 | $124,200 |
| 2022 | $1,592 | $153,500 | $30,200 | $123,300 |
| 2021 | $1,474 | $128,200 | $26,600 | $101,600 |
| 2020 | $1,530 | $121,700 | $26,600 | $95,100 |
| 2019 | $1,498 | $118,500 | $26,600 | $91,900 |
| 2018 | $1,148 | $117,700 | $24,200 | $93,500 |
| 2017 | $1,128 | $102,700 | $24,200 | $78,500 |
| 2016 | $1,386 | $102,200 | $24,200 | $78,000 |
| 2015 | $982 | $99,500 | $24,200 | $75,300 |
| 2014 | -- | $95,300 | $24,200 | $71,100 |
Source: Public Records
Map
Nearby Homes