Estimated Value: $810,019 - $958,000
4
Beds
3
Baths
2,702
Sq Ft
$319/Sq Ft
Est. Value
About This Home
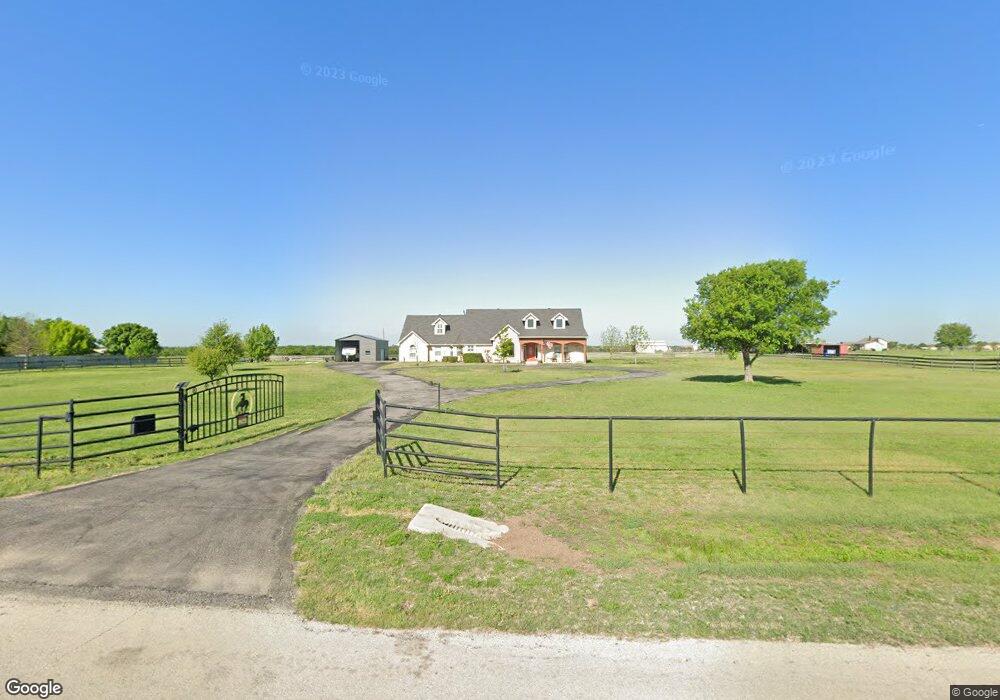
This home is located at 1621 Trent Rd, Krum, TX 76249 and is currently estimated at $861,340, approximately $318 per square foot. 1621 Trent Rd is a home located in Denton County with nearby schools including Krum Early Education Center, Dyer Elementary School, and Krum Middle School.
Ownership History
Date
Name
Owned For
Owner Type
Purchase Details
Closed on
Jun 6, 2014
Sold by
Baca Thomas E and Baca Patricia A
Bought by
Ehler Dennis and Ehler Tina
Current Estimated Value
Home Financials for this Owner
Home Financials are based on the most recent Mortgage that was taken out on this home.
Original Mortgage
$308,000
Outstanding Balance
$235,587
Interest Rate
4.35%
Mortgage Type
New Conventional
Estimated Equity
$625,753
Purchase Details
Closed on
Oct 18, 2010
Sold by
Nalley Brian Christopher and Nalley Nancy Louise
Bought by
Baca Thomas E and Baca Patricia A
Purchase Details
Closed on
May 11, 2007
Sold by
Harris Amalia and Harris Edward
Bought by
Nalley Brian Christopher and Elliott Nancy Louise
Home Financials for this Owner
Home Financials are based on the most recent Mortgage that was taken out on this home.
Original Mortgage
$256,000
Interest Rate
6.13%
Mortgage Type
Construction
Purchase Details
Closed on
Jan 17, 1996
Sold by
Lee Robert J
Bought by
Harris Amalia and Harris Edward
Create a Home Valuation Report for This Property
The Home Valuation Report is an in-depth analysis detailing your home's value as well as a comparison with similar homes in the area
Home Values in the Area
Average Home Value in this Area
Purchase History
| Date | Buyer | Sale Price | Title Company |
|---|---|---|---|
| Ehler Dennis | -- | None Available | |
| Baca Thomas E | -- | Hftc | |
| Nalley Brian Christopher | -- | Title Resources | |
| Harris Amalia | -- | -- |
Source: Public Records
Mortgage History
| Date | Status | Borrower | Loan Amount |
|---|---|---|---|
| Open | Ehler Dennis | $308,000 | |
| Previous Owner | Nalley Brian Christopher | $256,000 |
Source: Public Records
Tax History Compared to Growth
Tax History
| Year | Tax Paid | Tax Assessment Tax Assessment Total Assessment is a certain percentage of the fair market value that is determined by local assessors to be the total taxable value of land and additions on the property. | Land | Improvement |
|---|---|---|---|---|
| 2025 | $8,312 | $637,161 | $187,995 | $449,166 |
| 2024 | $9,555 | $673,960 | $0 | $0 |
| 2023 | $7,384 | $606,948 | $129,566 | $509,204 |
| 2022 | $9,078 | $555,237 | $65,481 | $664,913 |
| 2021 | $7,910 | $513,831 | $48,791 | $465,040 |
| 2020 | $7,416 | $458,594 | $48,797 | $427,868 |
| 2019 | $7,353 | $416,483 | $48,817 | $367,666 |
| 2018 | $7,138 | $401,493 | $48,827 | $352,666 |
| 2017 | $6,817 | $406,493 | $48,827 | $357,666 |
| 2016 | $6,391 | $346,513 | $48,847 | $297,666 |
| 2015 | $3,332 | $336,024 | $49,356 | $286,668 |
| 2013 | -- | $245,686 | $39,483 | $206,203 |
Source: Public Records
Map
Nearby Homes
- 1712 Nesting Robin Ln
- 1708 Nesting Robin Ln
- 1704 Nesting Robin Ln
- 1736 Willow Patch Dr
- 1732 Willow Patch Dr
- 1728 Willow Patch Dr
- Winfield Plan at The Meadows - Prairie Collection
- Ember Plan at The Meadows - Prairie Collection
- Avery Plan at The Meadows - Prairie Collection
- Savannah Plan at The Meadows - Discovery Collection
- Abeline Plan at The Meadows - Prairie Collection
- Quinn Plan at The Meadows - Prairie Collection
- Madison Plan at The Meadows - Discovery Collection
- Emery Plan at The Meadows - Discovery Collection
- Ivy Plan at The Meadows - Discovery Collection
- Evelyn Plan at The Meadows - Discovery Collection
- Lillian Plan at The Meadows - Discovery Collection
- Bailey Plan at The Meadows - Prairie Collection
- Mila Plan at The Meadows - Discovery Collection
- 1725 Sage Garden Dr
- 1543 Trent Rd
- 1725 Trent Rd
- 1517 Trent Rd
- 1492 Trent Rd
- 1718 Trent Rd
- 1451 Trent Rd
- 1448 Trent Rd
- 1840 Trent Rd
- 8045 Jackson Rd
- 1909 Trent Rd
- 1910 Trent Rd
- 1959 Trent Rd
- 7529 Sunset Valley Ln
- 7512 Sunset Valley Ln
- 7513 Sunset Valley Ln
- 7525 Sunset Valley Ln
- 7521 Sunset Valley Ln
- 7516 Sunset Valley Ln
- 7517 Sunset Valley Ln
- 7617 Sunset Valley Ln Unit 36491301