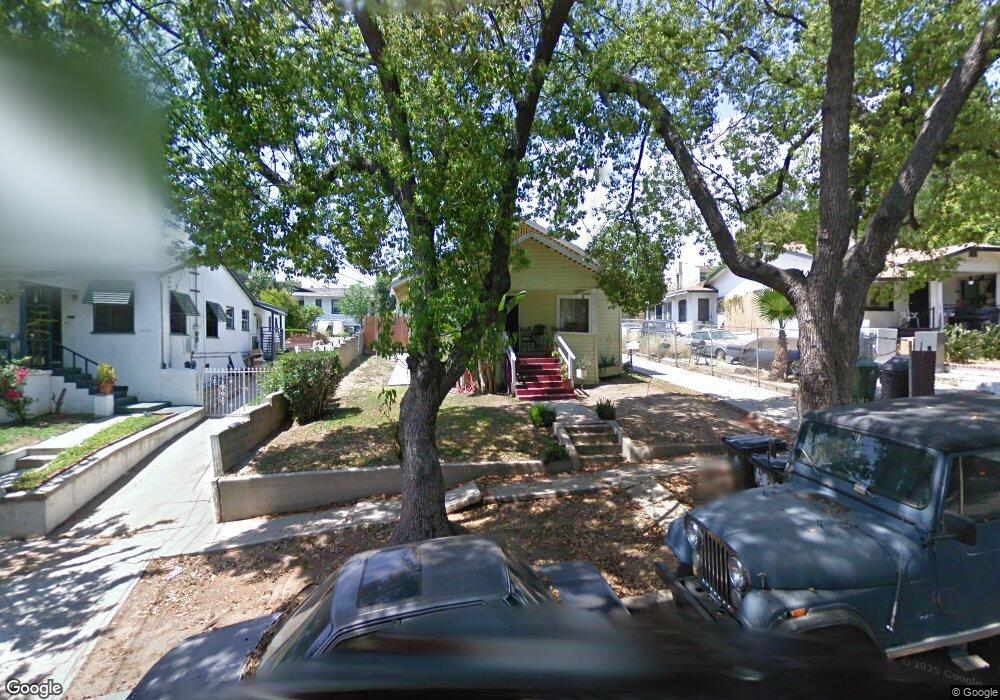
1621 Waterloo St Los Angeles, CA 90026
Echo Park NeighborhoodEstimated Value: $1,352,000 - $1,824,000
4
Beds
4
Baths
2,700
Sq Ft
$571/Sq Ft
Est. Value
About This Home
This home is located at 1621 Waterloo St, Los Angeles, CA 90026 and is currently estimated at $1,541,667, approximately $570 per square foot. 1621 Waterloo St is a home located in Los Angeles County with nearby schools including Mayberry Street Elementary, Thomas Starr King Middle School Film and Media Magnet, and John Marshall Senior High.
Ownership History
Date
Name
Owned For
Owner Type
Purchase Details
Closed on
Aug 26, 2002
Sold by
Euwer Paul Russell and Euwer Rosario G
Bought by
Euwer Paul Russell and Euwer Rosario Gahi
Current Estimated Value
Purchase Details
Closed on
May 31, 2002
Sold by
Euwer Paul Russell and Euwer Rosario Gahi
Bought by
Euwer Paul Russell and Euwer Rosario Gahi
Home Financials for this Owner
Home Financials are based on the most recent Mortgage that was taken out on this home.
Original Mortgage
$240,000
Interest Rate
6.83%
Purchase Details
Closed on
Feb 9, 1999
Sold by
Euwer Paul and Euwer Rosario G
Bought by
Euwer Paul Russell and Euwer Rosario Gahi
Purchase Details
Closed on
Sep 19, 1997
Sold by
Roberto Lauro L and Roberto Amalia M
Bought by
Fuwer Paul R and Euwer Rosario G
Purchase Details
Closed on
Apr 14, 1997
Sold by
Smock Vietta J
Bought by
Smock Family Trust
Create a Home Valuation Report for This Property
The Home Valuation Report is an in-depth analysis detailing your home's value as well as a comparison with similar homes in the area
Home Values in the Area
Average Home Value in this Area
Purchase History
| Date | Buyer | Sale Price | Title Company |
|---|---|---|---|
| Euwer Paul Russell | -- | -- | |
| Euwer Paul Russell | -- | Commerce Title Co | |
| Euwer Paul Russell | -- | -- | |
| Fuwer Paul R | -- | -- | |
| Smock Family Trust | -- | -- |
Source: Public Records
Mortgage History
| Date | Status | Borrower | Loan Amount |
|---|---|---|---|
| Previous Owner | Euwer Paul Russell | $240,000 |
Source: Public Records
Tax History Compared to Growth
Tax History
| Year | Tax Paid | Tax Assessment Tax Assessment Total Assessment is a certain percentage of the fair market value that is determined by local assessors to be the total taxable value of land and additions on the property. | Land | Improvement |
|---|---|---|---|---|
| 2025 | $4,772 | $362,765 | $239,505 | $123,260 |
| 2024 | $4,772 | $355,653 | $234,809 | $120,844 |
| 2023 | $4,688 | $348,680 | $230,205 | $118,475 |
| 2022 | $4,483 | $341,844 | $225,692 | $116,152 |
| 2021 | $4,417 | $335,142 | $221,267 | $113,875 |
| 2020 | $4,455 | $331,707 | $218,999 | $112,708 |
| 2019 | $4,293 | $325,204 | $214,705 | $110,499 |
| 2018 | $4,167 | $318,829 | $210,496 | $108,333 |
| 2016 | $3,962 | $306,450 | $202,323 | $104,127 |
| 2015 | $3,908 | $301,847 | $199,284 | $102,563 |
| 2014 | $3,947 | $295,935 | $195,381 | $100,554 |
Source: Public Records
Map
Nearby Homes
- 1615 N Coronado St
- 2505 Berkeley Ave
- 2252 Aaron St
- 1624 Allesandro St
- 1530 Allesandro St
- 1506 N Benton Way
- 1637 N Alvarado St
- 2210 Scott Ave
- 2635 Scott Ave
- 2132 Branden St
- 2126 Branden St
- 1947 Delta St
- 2123 Branden St
- 1937 Delta St
- 2311 Effie St
- 2150 Clifford St
- 2205 Selig Dr
- 1925 Berkeley Ave
- 1541 Silverwood Terrace
- 1506 Glendale Blvd
- 1617 Waterloo St
- 1625 Waterloo St
- 1619 Waterloo St
- 1633 Waterloo St
- 2409 Berkeley Ave
- 1639 Waterloo St
- 2415 Berkeley Ave
- 1622 N Coronado St
- 1618 N Coronado St
- 1626 N Coronado St
- 2419 Berkeley Ave
- 1612 Waterloo St
- 1645 Waterloo St
- 1643 Waterloo St
- 2423 Berkeley Ave
- 1620 Waterloo St
- 1624 Waterloo St
- 1616 Waterloo St
- 1632 N Coronado St
- 1608 N Coronado St