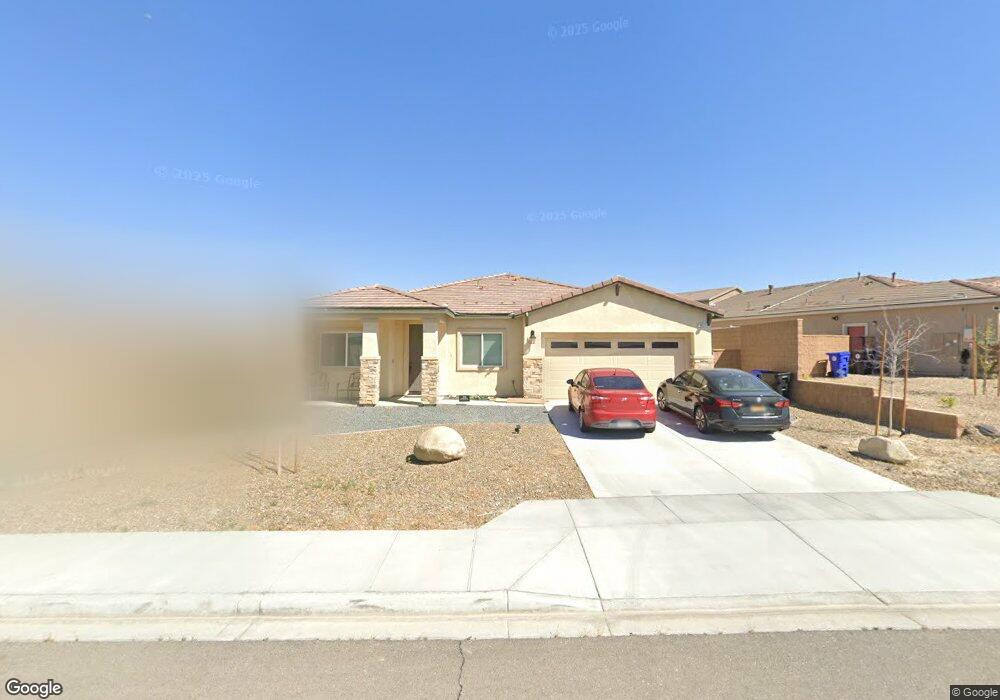
16211 Gibson St Victorville, CA 92394
Estimated Value: $460,000 - $504,000
4
Beds
3
Baths
2,226
Sq Ft
$214/Sq Ft
Est. Value
About This Home
This home is located at 16211 Gibson St, Victorville, CA 92394 and is currently estimated at $476,702, approximately $214 per square foot. 16211 Gibson St is a home located in San Bernardino County with nearby schools including Puesta Del Sol Elementary School, Challenger School Of Sports And Fitness, and Village Elementary School.
Ownership History
Date
Name
Owned For
Owner Type
Purchase Details
Closed on
Mar 27, 2019
Sold by
Arbor Meadows 56 Lp
Bought by
Castaneda Cyndi Dalee and Arellano Amanda
Current Estimated Value
Home Financials for this Owner
Home Financials are based on the most recent Mortgage that was taken out on this home.
Original Mortgage
$304,385
Outstanding Balance
$268,147
Interest Rate
4.4%
Mortgage Type
FHA
Estimated Equity
$208,555
Purchase Details
Closed on
Mar 22, 2018
Sold by
Lee And Stires Inc
Bought by
Arbor Meadows 56 Lp
Purchase Details
Closed on
Sep 6, 2017
Sold by
Gray1 Tuscany 91 Llc
Bought by
Lee & Stires Inc Profit Sharing Plan
Purchase Details
Closed on
Jan 11, 2010
Sold by
Arbor Lane Investments Llc
Bought by
Gray1 Tuscany 91 Llc
Create a Home Valuation Report for This Property
The Home Valuation Report is an in-depth analysis detailing your home's value as well as a comparison with similar homes in the area
Home Values in the Area
Average Home Value in this Area
Purchase History
| Date | Buyer | Sale Price | Title Company |
|---|---|---|---|
| Castaneda Cyndi Dalee | $310,000 | Ticor Title Company | |
| Arbor Meadows 56 Lp | -- | None Available | |
| Lee & Stires Inc Profit Sharing Plan | $1,350,000 | Chicago Title Company | |
| Gray1 Tuscany 91 Llc | $700,000 | Stewart Title Of Ca Inc |
Source: Public Records
Mortgage History
| Date | Status | Borrower | Loan Amount |
|---|---|---|---|
| Open | Castaneda Cyndi Dalee | $304,385 |
Source: Public Records
Tax History Compared to Growth
Tax History
| Year | Tax Paid | Tax Assessment Tax Assessment Total Assessment is a certain percentage of the fair market value that is determined by local assessors to be the total taxable value of land and additions on the property. | Land | Improvement |
|---|---|---|---|---|
| 2025 | $4,180 | $345,811 | $44,621 | $301,190 |
| 2024 | $4,180 | $339,030 | $43,746 | $295,284 |
| 2023 | $4,076 | $332,382 | $42,888 | $289,494 |
| 2022 | $4,076 | $325,865 | $42,047 | $283,818 |
| 2021 | $4,006 | $319,476 | $41,223 | $278,253 |
| 2020 | $3,938 | $316,200 | $40,800 | $275,400 |
| 2019 | $478 | $24,589 | $24,589 | $0 |
| 2018 | $507 | $24,107 | $24,107 | $0 |
| 2017 | $372 | $14,460 | $14,460 | $0 |
| 2016 | $368 | $14,176 | $14,176 | $0 |
| 2015 | $343 | $13,963 | $13,963 | $0 |
| 2014 | $337 | $13,689 | $13,689 | $0 |
Source: Public Records
Map
Nearby Homes
- 16252 Gibson St
- 15451 Ventura Ln
- 16000 Burwood Rd
- 15995 Yosemite St
- 16205 Llanada Ave
- 15998 Shawnee Ln
- 15668 Deep Canyon Ln
- 16405 Salinas St
- 16438 Llanada Ave
- 16452 Llanada Ave
- 16459 Bunnell Ave
- 15967 N Culver Rd
- 15009 Hopland St
- 16221 Vasquez Ave
- 15975 Village Dr
- 16628 Desert Lily St
- 15250 Garnet Cove
- 16604 Desert Star St
- 16609 Vasquez Ave
- 0 Vasquez Ave Unit 25007601
- 16233 Gibson St
- 16195 Gibson St
- 0 Gibson St
- 16249 Gibson St
- 16175 Gibson St
- 15404 Patton St
- 15396 Patton St
- 16163 Gibson St
- 16236 Gibson St
- 16220 Gibson St
- 16244 Gibson St
- 16202 Gibson St
- 16188 Gibson St
- 16176 Gibson St
- 16268 Gibson St
- 16255 Heatherdale Rd
- 16164 Gibson St
- 16239 Hamilton Ct
- 16227 Hamilton Ct
- 16276 Gibson St