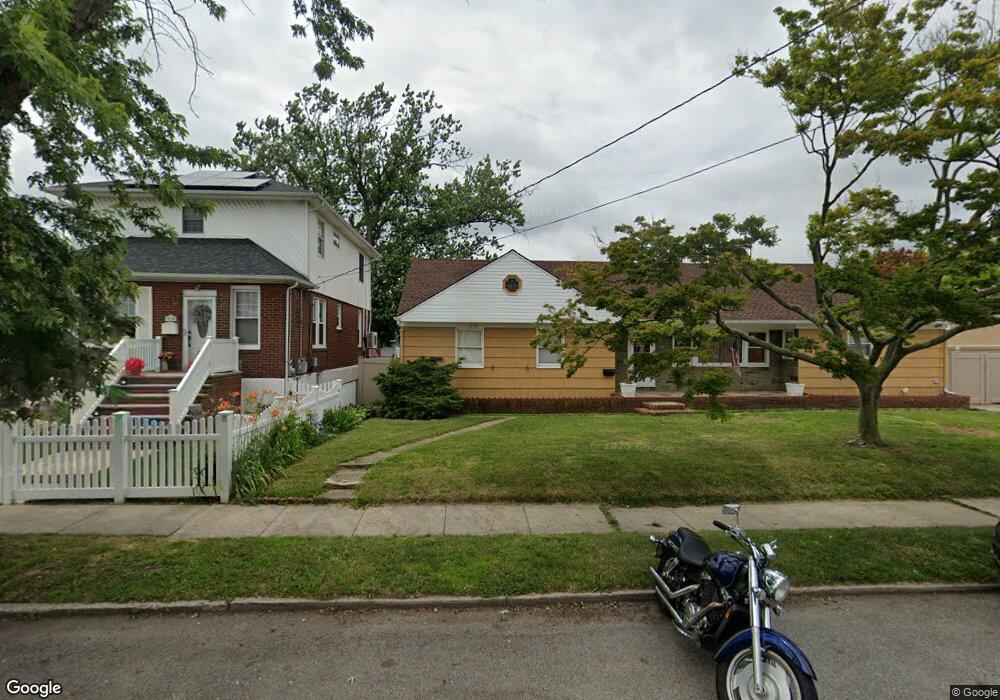
16226 96th St Howard Beach, NY 11414
Howard Beach NeighborhoodEstimated Value: $959,000 - $1,172,000
--
Bed
--
Bath
3,335
Sq Ft
$330/Sq Ft
Est. Value
About This Home
This home is located at 16226 96th St, Howard Beach, NY 11414 and is currently estimated at $1,099,759, approximately $329 per square foot. 16226 96th St is a home located in Queens County with nearby schools including P.S./M.S. 146 Howard Beach, Robert H. Goddard High School, and John Adams High School.
Ownership History
Date
Name
Owned For
Owner Type
Purchase Details
Closed on
Jun 2, 2017
Sold by
N Y Finest Management Inc
Bought by
Dulinski Isabella J and Dulinski Maciej D
Current Estimated Value
Home Financials for this Owner
Home Financials are based on the most recent Mortgage that was taken out on this home.
Original Mortgage
$500,000
Outstanding Balance
$415,896
Interest Rate
4.02%
Mortgage Type
Purchase Money Mortgage
Estimated Equity
$683,863
Purchase Details
Closed on
Jul 23, 2015
Sold by
Craig Marinucci As Executor
Bought by
Ny Finest Management Inc
Create a Home Valuation Report for This Property
The Home Valuation Report is an in-depth analysis detailing your home's value as well as a comparison with similar homes in the area
Home Values in the Area
Average Home Value in this Area
Purchase History
| Date | Buyer | Sale Price | Title Company |
|---|---|---|---|
| Dulinski Isabella J | $625,000 | -- | |
| Ny Finest Management Inc | $475,000 | -- |
Source: Public Records
Mortgage History
| Date | Status | Borrower | Loan Amount |
|---|---|---|---|
| Open | Dulinski Isabella J | $500,000 |
Source: Public Records
Tax History Compared to Growth
Tax History
| Year | Tax Paid | Tax Assessment Tax Assessment Total Assessment is a certain percentage of the fair market value that is determined by local assessors to be the total taxable value of land and additions on the property. | Land | Improvement |
|---|---|---|---|---|
| 2025 | $9,773 | $48,660 | $18,317 | $30,343 |
| 2024 | $9,773 | $48,660 | $19,751 | $28,909 |
| 2023 | $10,651 | $53,032 | $16,490 | $36,542 |
| 2022 | $6,907 | $51,180 | $18,060 | $33,120 |
| 2021 | $9,641 | $48,360 | $18,060 | $30,300 |
| 2020 | $8,548 | $45,720 | $18,060 | $27,660 |
| 2019 | $7,969 | $40,980 | $18,060 | $22,920 |
| 2018 | $7,326 | $35,940 | $18,060 | $17,880 |
| 2017 | $7,498 | $36,780 | $18,060 | $18,720 |
| 2016 | $8,648 | $36,780 | $18,060 | $18,720 |
| 2015 | $2,200 | $41,040 | $15,060 | $25,980 |
| 2014 | $2,200 | $41,040 | $15,060 | $25,980 |
Source: Public Records
Map
Nearby Homes