

1623 10th Ave SW Aberdeen, SD 57401
3
Beds
2
Baths
1,409
Sq Ft
2006
Built
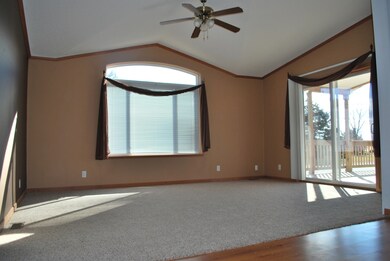
About This Home
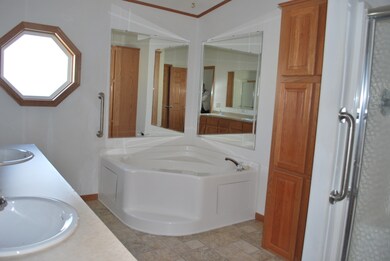
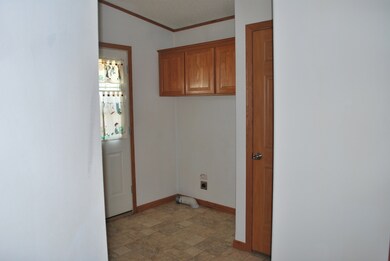
As of January 2025Great floor plan, patio doors off living room to large covered deck. Attractive unit in excellent condition, move in ready.
Property Details
Home Type
Mobile/Manufactured
Est. Annual Taxes
$1,015
Year Built
2006
Lot Details
0
Listing Details
- Listing Member Name: ARNIE ISAAK
- Listing Office Short Id: 0004
- Open House Office I D: 20000128204830275723000000
- Prop. Type: Residential
- Selling Member Short Id: IAS
- Selling Office Short Id: 0004
- Street Sfx: Avenue
- Building Style: Manufactured
- Year Built: 2006
- Above Grade Finished Sq Ft: 1409.00
- Appliances Refrigerators: 1
- Special Features: None
- Property Sub Type: MobileManufactured
Interior Features
- Flood Plain: No
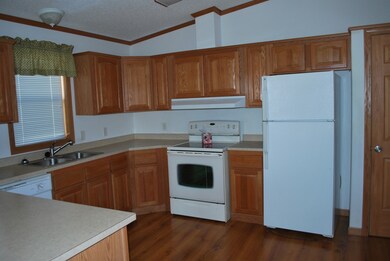
- Appliances: Dishwasher, Disposal, Range
- Total Bathrooms: 2.00
Exterior Features
- Roof: Composite
- Total Sq Ft: 1409.00
Garage/Parking
- Garage Stall: 0
- Garage Type: None
Utilities
- Cooling: Central Air
- Heating Fuel: Electric
- Heating: Forced Air
- Sewer: Public, Unknown
- Water Heater: Elec
Association/Amenities
- Deck: 10x27+
- AmenitiesWdwAppts: All
Fee Information
- Taxes: 1097.78
Lot Info
- Lot Size: Leased
Tax Info
- Tax Year: 2012
Multi Family
- Total Bedrooms: 3
Similar Home in Aberdeen, SD
Create a Home Valuation Report for This Property
The Home Valuation Report is an in-depth analysis detailing your home's value as well as a comparison with similar homes in the area
Home Values in the Area
Average Home Value in this Area
Property History
| Date | Event | Price | Change | Sq Ft Price |
|---|---|---|---|---|
| 06/21/2025 06/21/25 | For Sale | $68,900 | +6.4% | $44 / Sq Ft |
| 01/30/2025 01/30/25 | Sold | $64,750 | -6.8% | $53 / Sq Ft |
| 01/09/2025 01/09/25 | Off Market | $69,500 | -- | -- |
| 12/17/2024 12/17/24 | For Sale | $69,500 | +202.2% | $57 / Sq Ft |
| 09/19/2024 09/19/24 | Sold | $23,000 | -8.0% | $19 / Sq Ft |
| 09/01/2024 09/01/24 | Off Market | $25,000 | -- | -- |
| 08/01/2024 08/01/24 | For Sale | $25,000 | -58.7% | $21 / Sq Ft |
| 03/10/2023 03/10/23 | Sold | $60,500 | 0.0% | $39 / Sq Ft |
| 02/20/2023 02/20/23 | Off Market | $60,500 | -- | -- |
| 11/22/2022 11/22/22 | For Sale | $60,500 | +188.1% | $39 / Sq Ft |
| 09/29/2020 09/29/20 | Sold | $21,000 | -4.5% | $19 / Sq Ft |
| 09/22/2020 09/22/20 | Sold | $22,000 | -17.0% | $17 / Sq Ft |
| 09/10/2020 09/10/20 | Pending | -- | -- | -- |
| 09/07/2020 09/07/20 | Pending | -- | -- | -- |
| 01/08/2019 01/08/19 | Sold | $26,500 | +49.7% | $14 / Sq Ft |
| 12/30/2018 12/30/18 | Pending | -- | -- | -- |
| 05/24/2017 05/24/17 | Sold | $17,700 | -64.6% | $19 / Sq Ft |
| 05/12/2017 05/12/17 | Pending | -- | -- | -- |
| 05/02/2016 05/02/16 | Sold | $50,000 | +22.0% | $35 / Sq Ft |
| 04/29/2016 04/29/16 | Sold | $41,000 | +86.4% | $32 / Sq Ft |
| 04/21/2016 04/21/16 | Sold | $22,000 | +10.6% | $17 / Sq Ft |
| 03/17/2016 03/17/16 | Pending | -- | -- | -- |
| 03/12/2016 03/12/16 | Sold | $19,900 | +13.7% | $19 / Sq Ft |
| 03/10/2016 03/10/16 | Pending | -- | -- | -- |
| 03/08/2016 03/08/16 | Pending | -- | -- | -- |
| 02/28/2016 02/28/16 | Pending | -- | -- | -- |
| 08/21/2015 08/21/15 | Sold | $17,500 | -46.8% | $17 / Sq Ft |
| 07/30/2015 07/30/15 | Pending | -- | -- | -- |
| 01/27/2015 01/27/15 | Sold | $32,900 | +10.0% | $27 / Sq Ft |
| 01/27/2015 01/27/15 | Pending | -- | -- | -- |
| 08/20/2014 08/20/14 | Sold | $29,900 | -9.4% | $30 / Sq Ft |
| 08/20/2014 08/20/14 | Pending | -- | -- | -- |
| 06/24/2014 06/24/14 | Sold | $33,000 | +57.1% | $21 / Sq Ft |
| 06/16/2014 06/16/14 | Pending | -- | -- | -- |
| 09/10/2013 09/10/13 | Sold | $21,000 | -23.6% | $17 / Sq Ft |
| 09/06/2013 09/06/13 | Pending | -- | -- | -- |
| 02/18/2013 02/18/13 | Sold | $27,500 | +10.4% | $23 / Sq Ft |
| 01/25/2013 01/25/13 | Sold | $24,900 | -48.1% | $21 / Sq Ft |
| 01/25/2013 01/25/13 | Pending | -- | -- | -- |
| 12/07/2012 12/07/12 | Sold | $48,000 | +182.4% | $34 / Sq Ft |
| 12/06/2012 12/06/12 | Pending | -- | -- | -- |
| 10/25/2012 10/25/12 | Pending | -- | -- | -- |
| 04/25/2012 04/25/12 | Sold | $17,000 | -- | $18 / Sq Ft |
| 04/18/2012 04/18/12 | Pending | -- | -- | -- |
Source: Aberdeen Area Association of REALTORS®
Tax History Compared to Growth
Tax History
| Year | Tax Paid | Tax Assessment Tax Assessment Total Assessment is a certain percentage of the fair market value that is determined by local assessors to be the total taxable value of land and additions on the property. | Land | Improvement |
|---|---|---|---|---|
| 2024 | $1,015 | $61,371 | $0 | $61,371 |
| 2023 | $932 | $61,371 | $0 | $61,371 |
| 2022 | $956 | $54,198 | $0 | $54,198 |
| 2021 | $954 | $54,198 | $0 | $54,198 |
| 2020 | $941 | $53,581 | $0 | $53,581 |
| 2019 | $954 | $53,581 | $0 | $53,581 |
| 2018 | -- | $53,581 | $0 | $53,581 |
| 2017 | -- | $49,455 | $0 | $49,455 |
| 2016 | -- | $49,455 | $0 | $49,455 |
| 2015 | -- | $49,455 | $0 | $49,455 |
| 2014 | -- | $49,455 | $0 | $49,455 |
| 2011 | -- | $49,455 | $0 | $0 |
Source: Public Records
Agents Affiliated with this Home
-
Anne Johnson
A
Seller's Agent in 2025
Anne Johnson
Johnson & Johnson Real Estate
(701) 541-0927
32 Total Sales
-
Joel Hardin
J
Seller's Agent in 2025
Joel Hardin
Jency Realty Company
(605) 380-6000
3 Total Sales
-
Lisa Roach
Buyer's Agent in 2025
Lisa Roach
Jency Realty Company
(605) 380-3922
24 Total Sales
-
Melanie Bobby
Seller's Agent in 2023
Melanie Bobby
Jency Realty Company
(605) 216-3130
252 Total Sales
-
Ashton Davis
A
Buyer's Agent in 2023
Ashton Davis
Jency Realty Company
(605) 228-1067
150 Total Sales
-
Annaliese Favorite
A
Seller's Agent in 2020
Annaliese Favorite
Jency Realty Company
(605) 846-7598
25 Total Sales
Map
Source: Aberdeen Area Association of REALTORS®
MLS Number: 12-717
APN: 24764
Nearby Homes
- 1623 10th Ave SW
- 1517 9th Ave SW
- 1516 18th St S
- 1907 18th St S
- 1915 18th St S
- 1302 8th Ave SW
- 1024 8th Ave SW
- 708 S 10th St
- 915 S 9th St
- 906 16th Ave SW
- 2123 W Melgaard Rd
- 811 3rd Ave SW
- 2309 134th St
- 902 S 3rd St
- 301 8th Ave SW
- 205 9th Ave SW
- 512 W Melgaard Rd
- 724 S 2nd St
- 714 S 2nd St
- 220 5th Ave SW