


1623 10th Ave SW Aberdeen, SD 57401
3
Beds
2
Baths
1,280
Sq Ft
2010
Built
About This Home
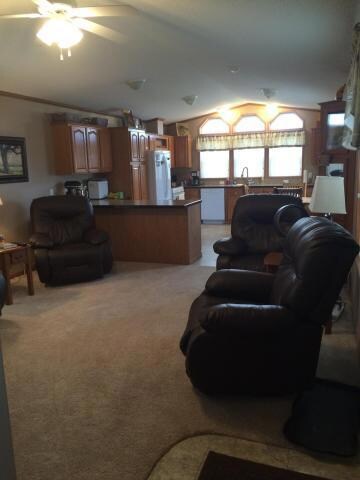
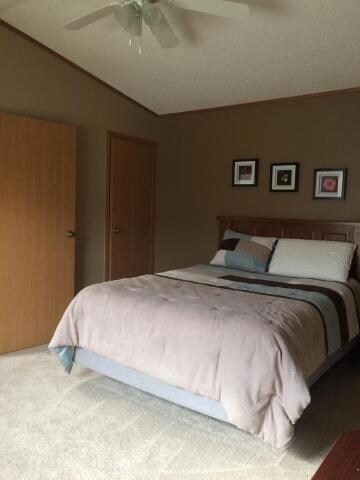
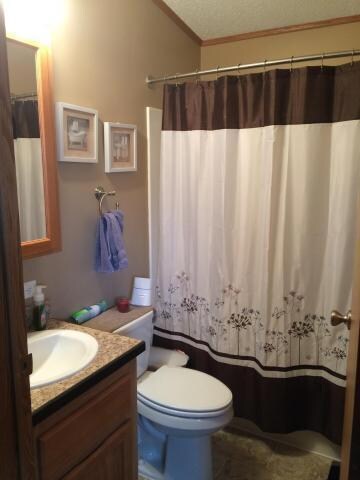
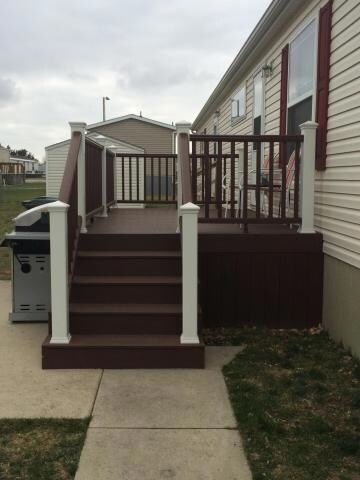
As of January 2025Seller willing give closing cost credit with acceptable offer. Space #1204. 2010 Highlander home with QUALITY updates! Vaulted ceilings, fenced in yard, zero-maintenance deck, Hunter Douglas Honey Comb Shades, Mohawk stain guard carpeting, ceramic tile. 2 full bathrooms with high-rise toilets. Financing options are available to qualified buyers. Can be moved! Contact Brittany Smart 605-290-14
Property Details
Home Type
Mobile/Manufactured
Est. Annual Taxes
$1,015
Year Built
2010
Lot Details
0
Listing Details
- Listing Member Name: Brittany A. Smart
- Listing Office Short Id: jam
- Open House Office I D: 20160127185044888052000000
- Prop. Type: Residential
- Selling Member Short Id: sma
- Selling Office Short Id: jam
- Street Sfx: Avenue
- Building Style: Manufactured
- Year Built: 2010
- Appliances Refrigerators: YES
- Special Features: None
- Property Sub Type: MobileManufactured
Interior Features
- Flood Plain: No
- Appliances: Dishwasher, Range
- Total Bathrooms: 2.00
Exterior Features
- Roof: Composite
- Total Sq Ft: 1280.00
Garage/Parking
- Garage Stall: 0
- Garage Type: Att
Utilities
- Cooling: Central Air
- Heating: Forced Air
- Sewer: Public
- Water Heater: Elec
Multi Family
- Total Bedrooms: 3
Similar Home in Aberdeen, SD
Create a Home Valuation Report for This Property
The Home Valuation Report is an in-depth analysis detailing your home's value as well as a comparison with similar homes in the area
Home Values in the Area
Average Home Value in this Area
Property History
| Date | Event | Price | Change | Sq Ft Price |
|---|---|---|---|---|
| 06/21/2025 06/21/25 | For Sale | $68,900 | +6.4% | $44 / Sq Ft |
| 01/30/2025 01/30/25 | Sold | $64,750 | -6.8% | $53 / Sq Ft |
| 01/09/2025 01/09/25 | Off Market | $69,500 | -- | -- |
| 12/17/2024 12/17/24 | For Sale | $69,500 | +202.2% | $57 / Sq Ft |
| 09/19/2024 09/19/24 | Sold | $23,000 | -8.0% | $19 / Sq Ft |
| 09/01/2024 09/01/24 | Off Market | $25,000 | -- | -- |
| 08/01/2024 08/01/24 | For Sale | $25,000 | -58.7% | $21 / Sq Ft |
| 03/10/2023 03/10/23 | Sold | $60,500 | 0.0% | $39 / Sq Ft |
| 02/20/2023 02/20/23 | Off Market | $60,500 | -- | -- |
| 11/22/2022 11/22/22 | For Sale | $60,500 | +188.1% | $39 / Sq Ft |
| 09/29/2020 09/29/20 | Sold | $21,000 | -4.5% | $19 / Sq Ft |
| 09/22/2020 09/22/20 | Sold | $22,000 | -17.0% | $17 / Sq Ft |
| 09/10/2020 09/10/20 | Pending | -- | -- | -- |
| 09/07/2020 09/07/20 | Pending | -- | -- | -- |
| 01/08/2019 01/08/19 | Sold | $26,500 | +49.7% | $14 / Sq Ft |
| 12/30/2018 12/30/18 | Pending | -- | -- | -- |
| 05/24/2017 05/24/17 | Sold | $17,700 | -64.6% | $19 / Sq Ft |
| 05/12/2017 05/12/17 | Pending | -- | -- | -- |
| 05/02/2016 05/02/16 | Sold | $50,000 | +22.0% | $35 / Sq Ft |
| 04/29/2016 04/29/16 | Sold | $41,000 | +86.4% | $32 / Sq Ft |
| 04/21/2016 04/21/16 | Sold | $22,000 | +10.6% | $17 / Sq Ft |
| 03/17/2016 03/17/16 | Pending | -- | -- | -- |
| 03/12/2016 03/12/16 | Sold | $19,900 | +13.7% | $19 / Sq Ft |
| 03/10/2016 03/10/16 | Pending | -- | -- | -- |
| 03/08/2016 03/08/16 | Pending | -- | -- | -- |
| 02/28/2016 02/28/16 | Pending | -- | -- | -- |
| 08/21/2015 08/21/15 | Sold | $17,500 | -46.8% | $17 / Sq Ft |
| 07/30/2015 07/30/15 | Pending | -- | -- | -- |
| 01/27/2015 01/27/15 | Sold | $32,900 | +10.0% | $27 / Sq Ft |
| 01/27/2015 01/27/15 | Pending | -- | -- | -- |
| 08/20/2014 08/20/14 | Sold | $29,900 | -9.4% | $30 / Sq Ft |
| 08/20/2014 08/20/14 | Pending | -- | -- | -- |
| 06/24/2014 06/24/14 | Sold | $33,000 | +57.1% | $21 / Sq Ft |
| 06/16/2014 06/16/14 | Pending | -- | -- | -- |
| 09/10/2013 09/10/13 | Sold | $21,000 | -23.6% | $17 / Sq Ft |
| 09/06/2013 09/06/13 | Pending | -- | -- | -- |
| 02/18/2013 02/18/13 | Sold | $27,500 | +10.4% | $23 / Sq Ft |
| 01/25/2013 01/25/13 | Sold | $24,900 | -48.1% | $21 / Sq Ft |
| 01/25/2013 01/25/13 | Pending | -- | -- | -- |
| 12/07/2012 12/07/12 | Sold | $48,000 | +182.4% | $34 / Sq Ft |
| 12/06/2012 12/06/12 | Pending | -- | -- | -- |
| 10/25/2012 10/25/12 | Pending | -- | -- | -- |
| 04/25/2012 04/25/12 | Sold | $17,000 | -- | $18 / Sq Ft |
| 04/18/2012 04/18/12 | Pending | -- | -- | -- |
Source: Aberdeen Area Association of REALTORS®
Tax History Compared to Growth
Tax History
| Year | Tax Paid | Tax Assessment Tax Assessment Total Assessment is a certain percentage of the fair market value that is determined by local assessors to be the total taxable value of land and additions on the property. | Land | Improvement |
|---|---|---|---|---|
| 2024 | $1,015 | $61,371 | $0 | $61,371 |
| 2023 | $932 | $61,371 | $0 | $61,371 |
| 2022 | $956 | $54,198 | $0 | $54,198 |
| 2021 | $954 | $54,198 | $0 | $54,198 |
| 2020 | $941 | $53,581 | $0 | $53,581 |
| 2019 | $954 | $53,581 | $0 | $53,581 |
| 2018 | -- | $53,581 | $0 | $53,581 |
| 2017 | -- | $49,455 | $0 | $49,455 |
| 2016 | -- | $49,455 | $0 | $49,455 |
| 2015 | -- | $49,455 | $0 | $49,455 |
| 2014 | -- | $49,455 | $0 | $49,455 |
| 2011 | -- | $49,455 | $0 | $0 |
Source: Public Records
Agents Affiliated with this Home
-
Anne Johnson
A
Seller's Agent in 2025
Anne Johnson
Johnson & Johnson Real Estate
(701) 541-0927
32 Total Sales
-
Joel Hardin
J
Seller's Agent in 2025
Joel Hardin
Jency Realty Company
(605) 380-6000
3 Total Sales
-
Lisa Roach
Buyer's Agent in 2025
Lisa Roach
Jency Realty Company
(605) 380-3922
24 Total Sales
-
Melanie Bobby
Seller's Agent in 2023
Melanie Bobby
Jency Realty Company
(605) 216-3130
252 Total Sales
-
Ashton Davis
A
Buyer's Agent in 2023
Ashton Davis
Jency Realty Company
(605) 228-1067
150 Total Sales
-
Annaliese Favorite
A
Seller's Agent in 2020
Annaliese Favorite
Jency Realty Company
(605) 846-7598
25 Total Sales
Map
Source: Aberdeen Area Association of REALTORS®
MLS Number: 16-64
APN: 24764
Nearby Homes
- 1623 10th Ave SW
- 1517 9th Ave SW
- 1516 18th St S
- 1907 18th St S
- 1915 18th St S
- 1302 8th Ave SW
- 1024 8th Ave SW
- 708 S 10th St
- 915 S 9th St
- 906 16th Ave SW
- 2123 W Melgaard Rd
- 811 3rd Ave SW
- 2309 134th St
- 902 S 3rd St
- 301 8th Ave SW
- 205 9th Ave SW
- 512 W Melgaard Rd
- 724 S 2nd St
- 714 S 2nd St
- 220 5th Ave SW