A
Seller's Agent in 2025
Anne Johnson
Johnson & Johnson Real Estate
(701) 541-0927
32 Total Sales
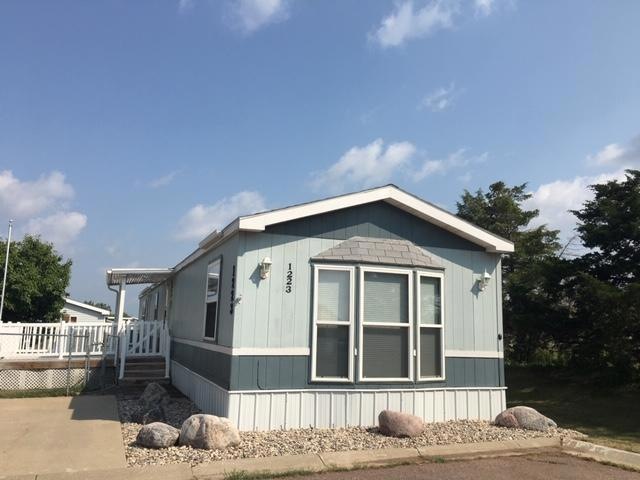
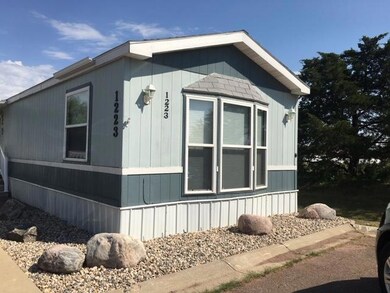
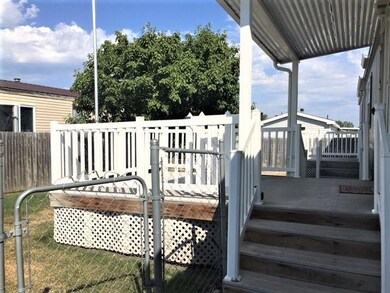
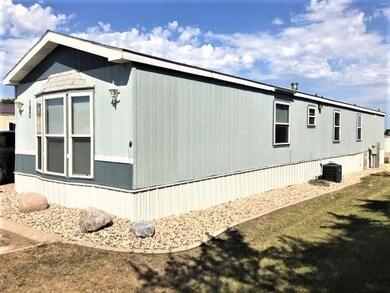
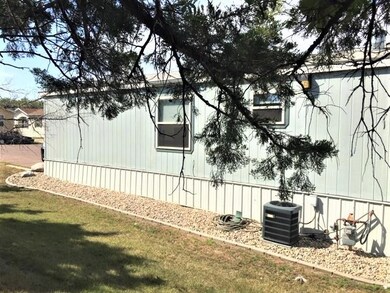
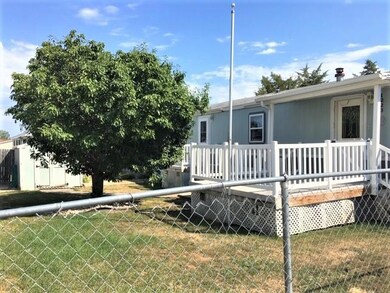
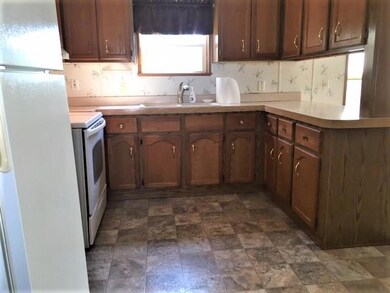
LOCATED IN A QUIET CUL DE SAC @ THE END OF THE STREET. A row of towering Evergreen trees on one side adjacent to a field . Privacy Fences in back and on side plus Chain link surrounds your property so littles and pets can be safe. Appreciate the work free decks w one large enough to grill, host table set and a lounger for your '' time out '' relaxation . The Shade tree increases the value as it covers deck & gives lovely charm as w new landscaping. Vaulted Ceiling, Easy Glide Custom Blinds by Hunter Douglas adorn the Living Dining Area. Built ins, room dividers and Bay window add to class. ALL open for enjoyment of the Chef in the Kitchen to enjoy TV or Guests/ Family. A M. Bedroom W a Large walk in as well as wall to wall closet. Add your own private bath. Life Easy and Low Cos
Home Type
Mobile/Manufactured
Est. Annual Taxes
$1,015
Year Built
1996
Lot Details
0
Listing Details
Interior Features
Exterior Features
Garage/Parking
Utilities
Association/Amenities
Fee Information
Lot Info
Tax Info
Multi Family
| Date | Event | Price | Change | Sq Ft Price |
|---|---|---|---|---|
| 06/21/2025 06/21/25 | For Sale | $68,900 | +6.4% | $44 / Sq Ft |
| 01/30/2025 01/30/25 | Sold | $64,750 | -6.8% | $53 / Sq Ft |
| 01/09/2025 01/09/25 | Off Market | $69,500 | -- | -- |
| 12/17/2024 12/17/24 | For Sale | $69,500 | +202.2% | $57 / Sq Ft |
| 09/19/2024 09/19/24 | Sold | $23,000 | -8.0% | $19 / Sq Ft |
| 09/01/2024 09/01/24 | Off Market | $25,000 | -- | -- |
| 08/01/2024 08/01/24 | For Sale | $25,000 | -58.7% | $21 / Sq Ft |
| 03/10/2023 03/10/23 | Sold | $60,500 | 0.0% | $39 / Sq Ft |
| 02/20/2023 02/20/23 | Off Market | $60,500 | -- | -- |
| 11/22/2022 11/22/22 | For Sale | $60,500 | +188.1% | $39 / Sq Ft |
| 09/29/2020 09/29/20 | Sold | $21,000 | -4.5% | $19 / Sq Ft |
| 09/22/2020 09/22/20 | Sold | $22,000 | -17.0% | $17 / Sq Ft |
| 09/10/2020 09/10/20 | Pending | -- | -- | -- |
| 09/07/2020 09/07/20 | Pending | -- | -- | -- |
| 01/08/2019 01/08/19 | Sold | $26,500 | +49.7% | $14 / Sq Ft |
| 12/30/2018 12/30/18 | Pending | -- | -- | -- |
| 05/24/2017 05/24/17 | Sold | $17,700 | -64.6% | $19 / Sq Ft |
| 05/12/2017 05/12/17 | Pending | -- | -- | -- |
| 05/02/2016 05/02/16 | Sold | $50,000 | +22.0% | $35 / Sq Ft |
| 04/29/2016 04/29/16 | Sold | $41,000 | +86.4% | $32 / Sq Ft |
| 04/21/2016 04/21/16 | Sold | $22,000 | +10.6% | $17 / Sq Ft |
| 03/17/2016 03/17/16 | Pending | -- | -- | -- |
| 03/12/2016 03/12/16 | Sold | $19,900 | +13.7% | $19 / Sq Ft |
| 03/10/2016 03/10/16 | Pending | -- | -- | -- |
| 03/08/2016 03/08/16 | Pending | -- | -- | -- |
| 02/28/2016 02/28/16 | Pending | -- | -- | -- |
| 08/21/2015 08/21/15 | Sold | $17,500 | -46.8% | $17 / Sq Ft |
| 07/30/2015 07/30/15 | Pending | -- | -- | -- |
| 01/27/2015 01/27/15 | Sold | $32,900 | +10.0% | $27 / Sq Ft |
| 01/27/2015 01/27/15 | Pending | -- | -- | -- |
| 08/20/2014 08/20/14 | Sold | $29,900 | -9.4% | $30 / Sq Ft |
| 08/20/2014 08/20/14 | Pending | -- | -- | -- |
| 06/24/2014 06/24/14 | Sold | $33,000 | +57.1% | $21 / Sq Ft |
| 06/16/2014 06/16/14 | Pending | -- | -- | -- |
| 09/10/2013 09/10/13 | Sold | $21,000 | -23.6% | $17 / Sq Ft |
| 09/06/2013 09/06/13 | Pending | -- | -- | -- |
| 02/18/2013 02/18/13 | Sold | $27,500 | +10.4% | $23 / Sq Ft |
| 01/25/2013 01/25/13 | Sold | $24,900 | -48.1% | $21 / Sq Ft |
| 01/25/2013 01/25/13 | Pending | -- | -- | -- |
| 12/07/2012 12/07/12 | Sold | $48,000 | +182.4% | $34 / Sq Ft |
| 12/06/2012 12/06/12 | Pending | -- | -- | -- |
| 10/25/2012 10/25/12 | Pending | -- | -- | -- |
| 04/25/2012 04/25/12 | Sold | $17,000 | -- | $18 / Sq Ft |
| 04/18/2012 04/18/12 | Pending | -- | -- | -- |
| Year | Tax Paid | Tax Assessment Tax Assessment Total Assessment is a certain percentage of the fair market value that is determined by local assessors to be the total taxable value of land and additions on the property. | Land | Improvement |
|---|---|---|---|---|
| 2024 | $1,015 | $61,371 | $0 | $61,371 |
| 2023 | $932 | $61,371 | $0 | $61,371 |
| 2022 | $956 | $54,198 | $0 | $54,198 |
| 2021 | $954 | $54,198 | $0 | $54,198 |
| 2020 | $941 | $53,581 | $0 | $53,581 |
| 2019 | $954 | $53,581 | $0 | $53,581 |
| 2018 | -- | $53,581 | $0 | $53,581 |
| 2017 | -- | $49,455 | $0 | $49,455 |
| 2016 | -- | $49,455 | $0 | $49,455 |
| 2015 | -- | $49,455 | $0 | $49,455 |
| 2014 | -- | $49,455 | $0 | $49,455 |
| 2011 | -- | $49,455 | $0 | $0 |
A
Seller's Agent in 2025
Anne Johnson
Johnson & Johnson Real Estate
(701) 541-0927
32 Total Sales
J
Seller's Agent in 2025
Joel Hardin
Jency Realty Company
(605) 380-6000
3 Total Sales

Buyer's Agent in 2025
Lisa Roach
Jency Realty Company
(605) 380-3922
24 Total Sales
Seller's Agent in 2023
Melanie Bobby
Jency Realty Company
(605) 216-3130
252 Total Sales
A
Buyer's Agent in 2023
Ashton Davis
Jency Realty Company
(605) 228-1067
150 Total Sales
A
Seller's Agent in 2020
Annaliese Favorite
Jency Realty Company
(605) 846-7598
25 Total Sales
Source: Aberdeen Area Association of REALTORS®
MLS Number: 20-604
APN: 24764