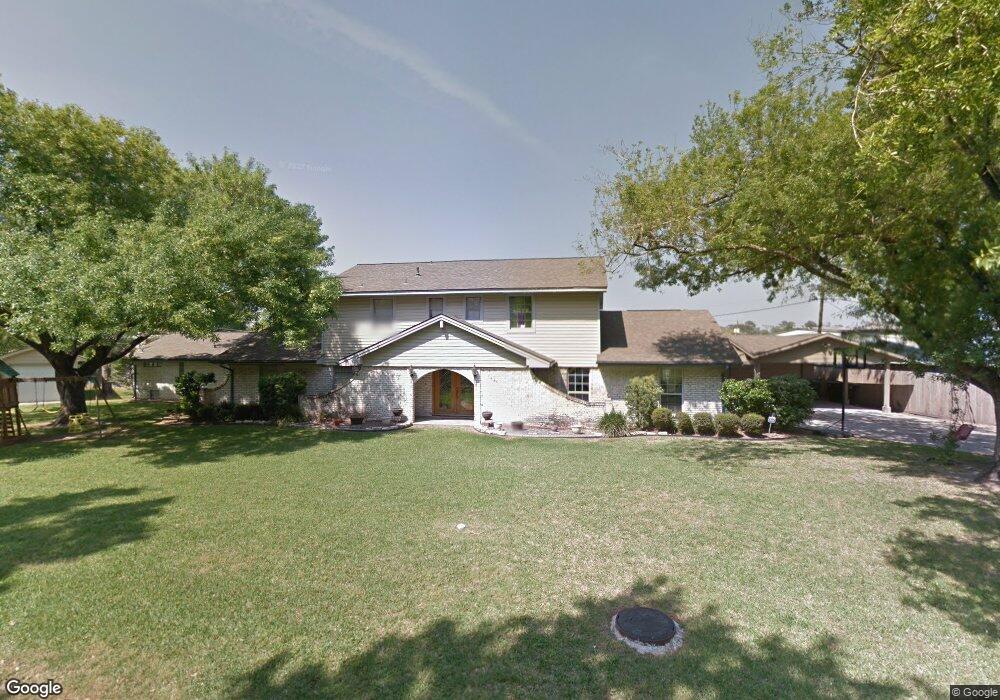
1626 Del Norte St Houston, TX 77018
Oak Forest-Garden Oaks NeighborhoodEstimated Value: $888,000 - $990,000
5
Beds
4
Baths
3,566
Sq Ft
$259/Sq Ft
Est. Value
About This Home
This home is located at 1626 Del Norte St, Houston, TX 77018 and is currently estimated at $921,917, approximately $258 per square foot. 1626 Del Norte St is a home located in Harris County with nearby schools including Oak Forest Elementary School, Frank Black Middle School, and Waltrip High School.
Ownership History
Date
Name
Owned For
Owner Type
Purchase Details
Closed on
Sep 16, 2025
Sold by
Bender Lori Ann
Bought by
Ramos Daniella Hope and Tidwell Hugh Coy
Current Estimated Value
Purchase Details
Closed on
Jun 4, 2019
Sold by
Jochen Larry and Jochen Dennis
Bought by
Bender Lori Ann and Bender Lori A
Home Financials for this Owner
Home Financials are based on the most recent Mortgage that was taken out on this home.
Original Mortgage
$252,000
Interest Rate
4.1%
Mortgage Type
Construction
Purchase Details
Closed on
Apr 21, 1998
Sold by
Bouska Jennifer
Bought by
Bender Lori Ann and Bouska Jennifer
Purchase Details
Closed on
Sep 16, 1997
Sold by
Baker Virginia
Bought by
Bouska Jennifer
Purchase Details
Closed on
Feb 1, 1996
Sold by
Baker Virginia and Baker Virginia B
Bought by
Baker Virginia
Create a Home Valuation Report for This Property
The Home Valuation Report is an in-depth analysis detailing your home's value as well as a comparison with similar homes in the area
Home Values in the Area
Average Home Value in this Area
Purchase History
| Date | Buyer | Sale Price | Title Company |
|---|---|---|---|
| Ramos Daniella Hope | -- | Old Republic National Title In | |
| Bender Lori Ann | -- | Fidelity National Title | |
| Bender Lori Ann | -- | -- | |
| Bouska Jennifer | -- | -- | |
| Baker Virginia | -- | -- |
Source: Public Records
Mortgage History
| Date | Status | Borrower | Loan Amount |
|---|---|---|---|
| Previous Owner | Bender Lori Ann | $252,000 |
Source: Public Records
Tax History Compared to Growth
Tax History
| Year | Tax Paid | Tax Assessment Tax Assessment Total Assessment is a certain percentage of the fair market value that is determined by local assessors to be the total taxable value of land and additions on the property. | Land | Improvement |
|---|---|---|---|---|
| 2025 | $6,591 | $673,550 | $395,120 | $278,430 |
| 2024 | $6,591 | $657,031 | $395,120 | $261,911 |
| 2023 | $6,591 | $647,608 | $395,120 | $252,488 |
| 2022 | $13,507 | $613,421 | $395,120 | $218,301 |
| 2021 | $14,160 | $607,561 | $395,120 | $212,441 |
| 2020 | $14,271 | $589,338 | $395,120 | $194,218 |
| 2019 | $14,698 | $580,827 | $395,120 | $185,707 |
| 2018 | $10,552 | $580,827 | $395,120 | $185,707 |
| 2017 | $12,264 | $580,827 | $395,120 | $185,707 |
| 2016 | $11,149 | $580,827 | $395,120 | $185,707 |
| 2015 | $7,353 | $580,827 | $395,120 | $185,707 |
| 2014 | $7,353 | $401,494 | $263,413 | $138,081 |
Source: Public Records
Map
Nearby Homes
- 5128 Rosslyn Rd
- 5132 Rosslyn Rd
- 5142 Rosslyn Rd
- 5144 Rosslyn Rd
- 1802 Del Norte St Unit A
- 1802 Del Norte St Unit C
- 1804 Del Norte St Unit D
- 1804 Del Norte St Unit C
- 3913 Pinemont Dr
- 3919 Pinemont Dr
- TBD-33-46 Creekmont Dr
- 1410 Del Norte St
- 4410 Deer Lodge Dr
- 1622 Candlelight Ln
- 1402 Hewitt Dr
- 4411 Deer Lodge Dr
- 1402 Lehman St
- 4019 Delta Rose St
- 1843 Candlelight Place Dr
- 4027 Delta Rose St
- 5126 E Jerad Dr
- 5122 E Jerad Dr
- 5130 E Jerad Dr
- 5118 E Jerad Dr
- 5134 E Jerad Dr
- 1614 Del Norte St
- 1619 Del Norte St
- 5123 E Jerad Dr
- 5138 E Jerad Dr
- 5114 E Jerad Dr
- 5109 Covington Dr
- 1615 Del Norte St
- 5119 E Jerad Dr
- 1610 Del Norte St
- 5110 E Jerad Dr
- 5118 W Jerad Dr
- 5115 E Jerad Dr
- 5142 E Jerad Dr
- 1618 Lehman St
- 1611 Del Norte St