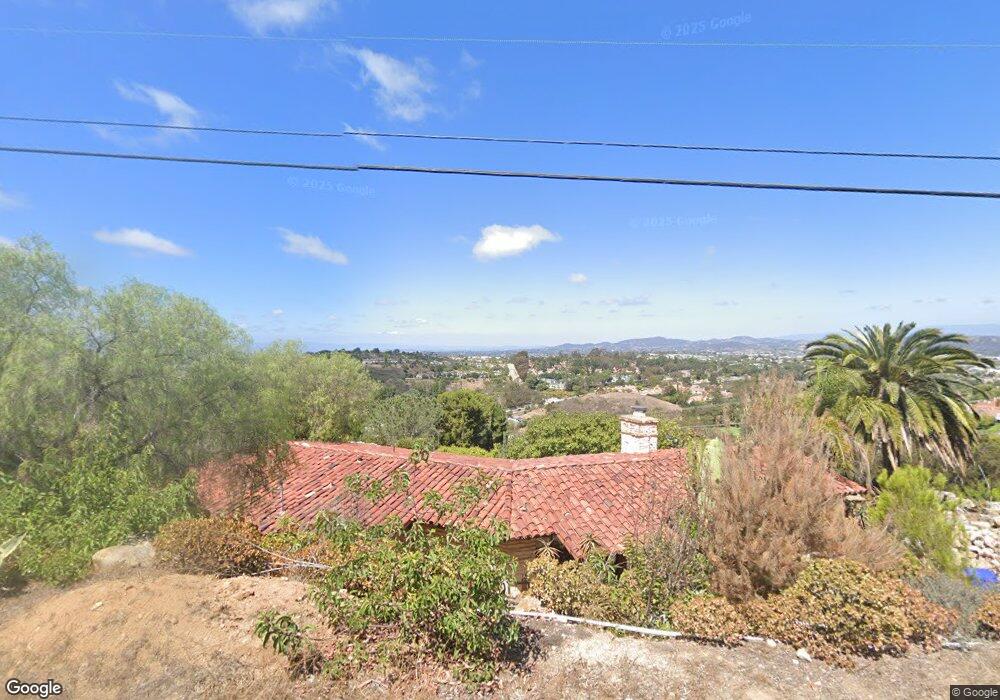
1626 Via Del Corvo San Marcos, CA 92078
Estimated Value: $935,000 - $1,100,000
2
Beds
2
Baths
1,443
Sq Ft
$688/Sq Ft
Est. Value
About This Home
This home is located at 1626 Via Del Corvo, San Marcos, CA 92078 and is currently estimated at $992,223, approximately $687 per square foot. 1626 Via Del Corvo is a home located in San Diego County with nearby schools including Discovery Elementary School, San Elijo Middle School, and San Marcos High School.
Ownership History
Date
Name
Owned For
Owner Type
Purchase Details
Closed on
Mar 24, 2005
Sold by
Fox Benjamin and Fox Benjamin Carl
Bought by
Fox Benjamin
Current Estimated Value
Home Financials for this Owner
Home Financials are based on the most recent Mortgage that was taken out on this home.
Original Mortgage
$400,000
Outstanding Balance
$262,724
Interest Rate
10.45%
Mortgage Type
Unknown
Estimated Equity
$729,499
Purchase Details
Closed on
Oct 9, 2002
Sold by
Madden Robert A and Madden Carole Pryor
Bought by
Fox Benjamin Carl
Home Financials for this Owner
Home Financials are based on the most recent Mortgage that was taken out on this home.
Original Mortgage
$256,000
Interest Rate
8.87%
Purchase Details
Closed on
Sep 28, 2000
Sold by
Madden Robert A
Bought by
Madden Robert A and Madden Carole Pryor
Purchase Details
Closed on
Mar 31, 1993
Purchase Details
Closed on
Jun 20, 1990
Create a Home Valuation Report for This Property
The Home Valuation Report is an in-depth analysis detailing your home's value as well as a comparison with similar homes in the area
Home Values in the Area
Average Home Value in this Area
Purchase History
| Date | Buyer | Sale Price | Title Company |
|---|---|---|---|
| Fox Benjamin | -- | Alliance Title San Diego | |
| Fox Benjamin Carl | $320,000 | American Title Ins Co | |
| Madden Robert A | -- | -- | |
| -- | $285,000 | -- | |
| -- | $359,000 | -- |
Source: Public Records
Mortgage History
| Date | Status | Borrower | Loan Amount |
|---|---|---|---|
| Open | Fox Benjamin | $400,000 | |
| Previous Owner | Fox Benjamin Carl | $256,000 |
Source: Public Records
Tax History Compared to Growth
Tax History
| Year | Tax Paid | Tax Assessment Tax Assessment Total Assessment is a certain percentage of the fair market value that is determined by local assessors to be the total taxable value of land and additions on the property. | Land | Improvement |
|---|---|---|---|---|
| 2025 | $5,618 | $463,452 | $231,726 | $231,726 |
| 2024 | $5,618 | $454,366 | $227,183 | $227,183 |
| 2023 | $11,883 | $445,458 | $222,729 | $222,729 |
| 2022 | $5,457 | $436,724 | $218,362 | $218,362 |
| 2021 | $5,236 | $428,162 | $214,081 | $214,081 |
| 2020 | $5,031 | $423,772 | $211,886 | $211,886 |
| 2019 | $4,818 | $415,464 | $207,732 | $207,732 |
| 2018 | $4,668 | $407,318 | $203,659 | $203,659 |
| 2017 | $762 | $399,332 | $199,666 | $199,666 |
| 2016 | $4,511 | $391,502 | $195,751 | $195,751 |
| 2015 | $4,448 | $385,622 | $192,811 | $192,811 |
| 2014 | $4,348 | $378,070 | $189,035 | $189,035 |
Source: Public Records
Map
Nearby Homes
- 1265 Camino Lorado
- 1263 Via Navajo
- 1803 Towhee St
- 1219 Via San Jacinto
- 1218 Via Apuesto
- 1210 Via Apuesto
- 1299 Via Apuesto
- 2434 Sentinel Ln
- 6691 Corte Eduardo
- 2513 Antlers Way
- 1349 Via Firenze
- 1690 Via Inspirar Unit 149
- 2092 Silverado St
- 2145 Silverado St
- 3137 Avenida Topanga
- 3139 Avenida Olmeda
- 2196 Coast Ave
- 1259 La Casa Dr
- 6412 Terraza Portico
- 6417 Terraza Portico
- 1654 Via Del Corvo
- 1635 Via Del Corvo
- 1629 Via Allondra
- 1608 Via Del Corvo
- 1655 Via Del Corvo
- 000 000 Via Del Corvo
- 000 000 Via Del Corvo Unit 1
- 1668 Via Del Corvo
- 1472 Via Del Corvo Unit 60
- 1472 Via Del Corvo Unit 27
- 1661 Via Allondra
- 1627 Via Allondra
- 1671 Via Del Corvo
- 1689 Via Allondra
- 1674 Via Del Corvo
- 1648 Via Allondra
- 1560 Via Del Corvo
- 1680 Via Del Corvo
- 1618 Via Allondra
- 1761 Via Allondra