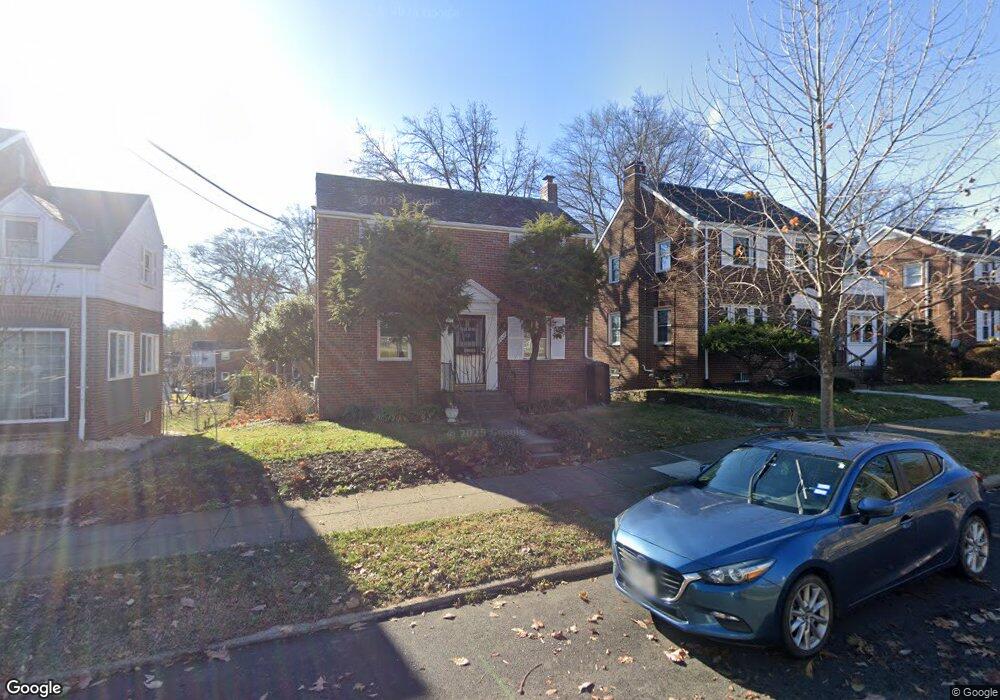
1627 Webster St NE Washington, DC 20017
Michigan Park NeighborhoodEstimated Value: $559,863 - $792,000
3
Beds
2
Baths
1,134
Sq Ft
$585/Sq Ft
Est. Value
About This Home
This home is located at 1627 Webster St NE, Washington, DC 20017 and is currently estimated at $663,216, approximately $584 per square foot. 1627 Webster St NE is a home located in District of Columbia with nearby schools including Bunker Hill Elementary School, Brookland Middle School, and Dunbar High School.
Ownership History
Date
Name
Owned For
Owner Type
Purchase Details
Closed on
Jun 15, 2016
Sold by
Hillman Alison A and Velasoquez Marcel
Bought by
Hillman Alison A
Current Estimated Value
Purchase Details
Closed on
May 28, 2010
Sold by
Spears Sandra E
Bought by
Hillman Alison A and Velasquez Marcel
Home Financials for this Owner
Home Financials are based on the most recent Mortgage that was taken out on this home.
Original Mortgage
$370,017
Interest Rate
4.87%
Mortgage Type
FHA
Purchase Details
Closed on
Sep 15, 1997
Sold by
Brinkley Camel L
Bought by
Lopez Juan
Purchase Details
Closed on
Jun 17, 1994
Sold by
Chupka Marc W
Bought by
Sanders Antonia L
Home Financials for this Owner
Home Financials are based on the most recent Mortgage that was taken out on this home.
Original Mortgage
$145,350
Interest Rate
8.5%
Create a Home Valuation Report for This Property
The Home Valuation Report is an in-depth analysis detailing your home's value as well as a comparison with similar homes in the area
Home Values in the Area
Average Home Value in this Area
Purchase History
| Date | Buyer | Sale Price | Title Company |
|---|---|---|---|
| Hillman Alison A | -- | None Available | |
| Hillman Alison A | $375,000 | -- | |
| Lopez Juan | $105,000 | Island Title Corp | |
| Sanders Antonia L | $153,000 | -- |
Source: Public Records
Mortgage History
| Date | Status | Borrower | Loan Amount |
|---|---|---|---|
| Previous Owner | Hillman Alison A | $370,017 | |
| Previous Owner | Sanders Antonia L | $145,350 |
Source: Public Records
Tax History Compared to Growth
Tax History
| Year | Tax Paid | Tax Assessment Tax Assessment Total Assessment is a certain percentage of the fair market value that is determined by local assessors to be the total taxable value of land and additions on the property. | Land | Improvement |
|---|---|---|---|---|
| 2025 | $4,471 | $615,800 | $364,320 | $251,480 |
| 2024 | $4,407 | $605,470 | $362,520 | $242,950 |
| 2023 | $4,218 | $584,620 | $350,060 | $234,560 |
| 2022 | $3,879 | $535,100 | $316,790 | $218,310 |
| 2021 | $3,742 | $516,600 | $312,090 | $204,510 |
| 2020 | $3,470 | $483,960 | $306,480 | $177,480 |
| 2019 | $3,288 | $461,620 | $288,070 | $173,550 |
| 2018 | $3,143 | $443,090 | $0 | $0 |
| 2017 | $2,935 | $417,720 | $0 | $0 |
| 2016 | $2,701 | $389,450 | $0 | $0 |
| 2015 | $2,594 | $376,520 | $0 | $0 |
| 2014 | $2,395 | $352,020 | $0 | $0 |
Source: Public Records
Map
Nearby Homes
- 1739 Allison St NE
- 1612 Buchanan St NE
- 4716 Queens Chapel Terrace NE
- 1604 Crittenden St NE
- 1355 Michigan Ave NE
- 1719 Taylor St NE
- 4526 South Dakota Ave NE
- 4414 13th Place NE
- 4200 19th St NE
- 4417 20th St NE
- 1821 Shepherd St NE
- 4200 13th St NE
- 4509 12th St NE
- 4016 21st St NE
- 2107 Brighton Rd
- 4911 Sargent Rd NE
- 1251 Emerson St NE
- 1929 Randolph St NE
- 4913 12th St NE
- 1005 Urell Place NE
- 1623 Webster St NE
- 1631 Webster St NE
- 1619 Webster St NE
- 1635 Webster St NE
- 1639 Webster St NE
- 1615 Webster St NE
- 1622 Varnum Place NE
- 1630 Varnum Place NE
- 1634 Varnum Place NE
- 1618 Varnum Place NE
- 1643 Webster St NE
- 1611 Webster St NE
- 1638 Varnum Place NE
- 1614 Varnum Place NE
- 1642 Varnum Place NE
- 1647 Webster St NE
- 1610 Varnum Place NE
- 1646 Varnum Place NE
- 1651 Webster St NE
- 1600 Webster St NE