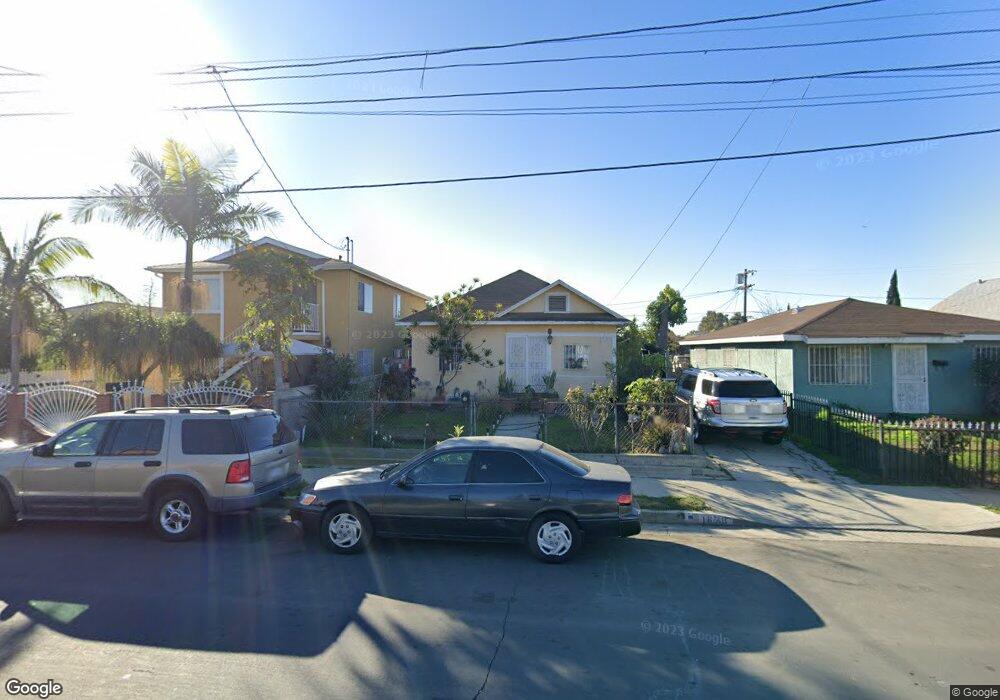
1628 E 51st St Los Angeles, CA 90011
Central Alameda NeighborhoodEstimated Value: $524,000 - $540,000
2
Beds
1
Bath
894
Sq Ft
$593/Sq Ft
Est. Value
About This Home
This home is located at 1628 E 51st St, Los Angeles, CA 90011 and is currently estimated at $530,171, approximately $593 per square foot. 1628 E 51st St is a home located in Los Angeles County with nearby schools including Hooper Avenue Elementary School, Los Angeles Academy Middle School, and Nava College Preparatory Academy.
Ownership History
Date
Name
Owned For
Owner Type
Purchase Details
Closed on
Mar 22, 2009
Sold by
Martinez Rodolfo and Robles Francisco
Bought by
Robles Francisco
Current Estimated Value
Purchase Details
Closed on
May 21, 2004
Sold by
Martinez Rodolfo
Bought by
Martinez Rodolfo
Purchase Details
Closed on
Oct 5, 1994
Sold by
Martinez Arturo
Bought by
Martinez Rodolfo
Purchase Details
Closed on
May 19, 1994
Sold by
Martinez Rosa
Bought by
Martinez Arturo
Purchase Details
Closed on
Sep 16, 1993
Sold by
Martinez Rosa and Martinez Rodolfo
Bought by
Martinez Rosa
Home Financials for this Owner
Home Financials are based on the most recent Mortgage that was taken out on this home.
Original Mortgage
$80,000
Interest Rate
3.95%
Purchase Details
Closed on
Sep 14, 1991
Sold by
Quintero Antonio Robles and Quintero Antonio
Bought by
Martinez Rosa
Create a Home Valuation Report for This Property
The Home Valuation Report is an in-depth analysis detailing your home's value as well as a comparison with similar homes in the area
Home Values in the Area
Average Home Value in this Area
Purchase History
| Date | Buyer | Sale Price | Title Company |
|---|---|---|---|
| Robles Francisco | -- | None Available | |
| Martinez Rodolfo | -- | -- | |
| Martinez Rodolfo | -- | -- | |
| Martinez Arturo | -- | -- | |
| Martinez Rosa | -- | Orange Coast Title | |
| Martinez Rosa | -- | Orange Coast Title |
Source: Public Records
Mortgage History
| Date | Status | Borrower | Loan Amount |
|---|---|---|---|
| Previous Owner | Martinez Rosa | $80,000 |
Source: Public Records
Tax History Compared to Growth
Tax History
| Year | Tax Paid | Tax Assessment Tax Assessment Total Assessment is a certain percentage of the fair market value that is determined by local assessors to be the total taxable value of land and additions on the property. | Land | Improvement |
|---|---|---|---|---|
| 2025 | $1,906 | $141,637 | $90,135 | $51,502 |
| 2024 | $1,906 | $138,861 | $88,368 | $50,493 |
| 2023 | $1,873 | $136,139 | $86,636 | $49,503 |
| 2022 | $1,791 | $133,471 | $84,938 | $48,533 |
| 2021 | $1,766 | $130,855 | $83,273 | $47,582 |
| 2019 | $1,717 | $126,976 | $80,804 | $46,172 |
| 2018 | $1,661 | $124,487 | $79,220 | $45,267 |
| 2016 | $1,581 | $119,655 | $76,145 | $43,510 |
| 2015 | $1,560 | $117,859 | $75,002 | $42,857 |
| 2014 | $1,574 | $115,551 | $73,533 | $42,018 |
Source: Public Records
Map
Nearby Homes
- 4905 Morgan Ave
- 1517 E 52nd St
- 5110 Compton Ave
- 4867 Long Beach Ave
- 1548 E 54th St
- 1458 E 50th St Unit 4
- 1426 E 50th St
- 1407 E 50th St
- 5606 Fortuna St
- 1739 E 57th St
- 1712 E 57th St
- 4439 Lima St
- 1266 E 50th St
- 5727 Bandera St
- 4427 Lima St
- 5746 Holmes Ave
- 4327 Honduras St
- 1192 E 48th St
- 1490 E 43rd St
- 1150 E 51st St
- 1632 E 51st St
- 1624 E 51st St
- 1584 E 51st St
- 1634 E 51st St
- 1580 E 51st St
- 1640 E 51st St
- 1625 E 52nd St
- 1617 E 52nd St
- 1629 E 52nd St
- 1615 E 52nd St
- 1635 E 52nd St
- 1642 E 51st St
- 1578 E 51st St
- 1644 E 50th Place
- 1636 E 50th Place
- 1652 E 50th Place
- 1613 E 52nd St
- 1637 E 52nd St
- 1658 E 50th Place
- 1646 E 51st St