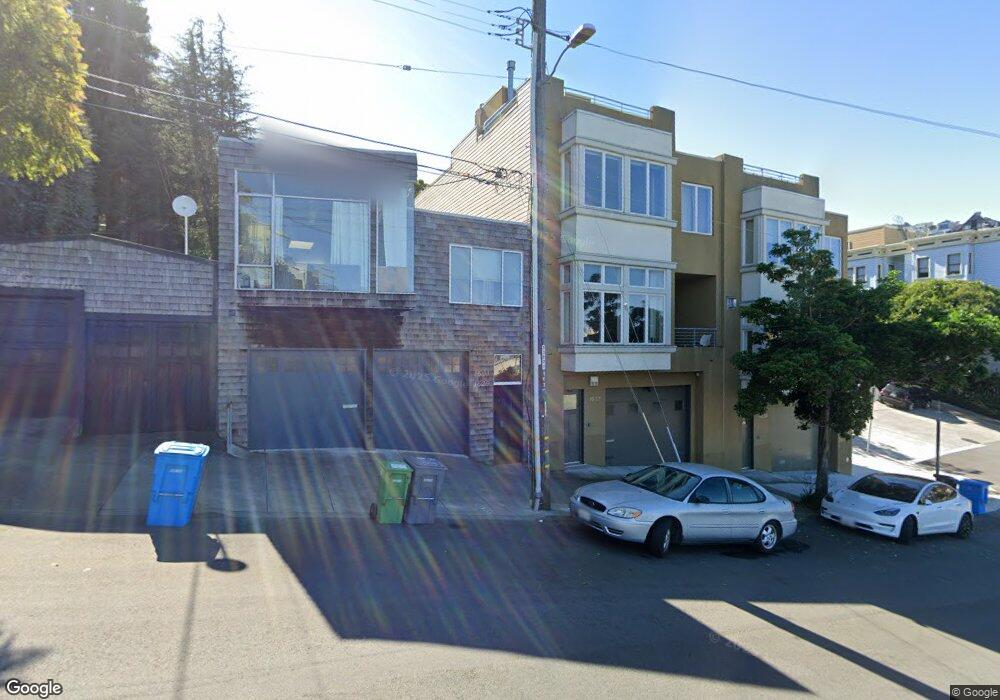
1629 19th St San Francisco, CA 94107
Potrero NeighborhoodEstimated Value: $1,656,000 - $2,182,000
2
Beds
2
Baths
1,619
Sq Ft
$1,132/Sq Ft
Est. Value
About This Home
This home is located at 1629 19th St, San Francisco, CA 94107 and is currently estimated at $1,833,184, approximately $1,132 per square foot. 1629 19th St is a home located in San Francisco County with nearby schools including Daniel Webster Elementary School, James Lick Middle School, and The New School of San Francisco.
Ownership History
Date
Name
Owned For
Owner Type
Purchase Details
Closed on
May 16, 2024
Sold by
Liang Wenjian
Bought by
Wenjian Liang Living Trust and Liang
Current Estimated Value
Purchase Details
Closed on
Mar 18, 2024
Sold by
Alfred Moy Grantor Trust and Liang Wenjian
Bought by
Liang Wenjian
Purchase Details
Closed on
Dec 23, 2019
Sold by
Moy Alfred
Bought by
Moy Alfred and Alfred Moy Grantor Trust
Purchase Details
Closed on
Jan 29, 2016
Sold by
The Joyce A Moy Revocable Trust and Moy Alfred
Bought by
Moy Alfred
Purchase Details
Closed on
May 10, 2012
Sold by
Moy Joyce Ann
Bought by
Joyce A Moy Revocable Trust and Moy Joyce Ann
Purchase Details
Closed on
Aug 19, 2009
Sold by
Moy Helen W
Bought by
Moy Helen W and Moy Joyce Ann
Purchase Details
Closed on
Jan 19, 2009
Sold by
The Alfred Moy Grantor Trust and Moy Alfred
Bought by
Moy Helen W
Create a Home Valuation Report for This Property
The Home Valuation Report is an in-depth analysis detailing your home's value as well as a comparison with similar homes in the area
Home Values in the Area
Average Home Value in this Area
Purchase History
| Date | Buyer | Sale Price | Title Company |
|---|---|---|---|
| Wenjian Liang Living Trust | -- | None Listed On Document | |
| Liang Wenjian | -- | None Listed On Document | |
| Moy Alfred | -- | None Available | |
| Moy Alfred | -- | None Available | |
| Joyce A Moy Revocable Trust | -- | None Available | |
| Moy Helen W | -- | None Available | |
| Moy Helen W | -- | None Available |
Source: Public Records
Tax History Compared to Growth
Tax History
| Year | Tax Paid | Tax Assessment Tax Assessment Total Assessment is a certain percentage of the fair market value that is determined by local assessors to be the total taxable value of land and additions on the property. | Land | Improvement |
|---|---|---|---|---|
| 2025 | $20,910 | $1,742,672 | $1,219,874 | $522,798 |
| 2024 | $20,910 | $1,708,503 | $1,195,955 | $512,548 |
| 2023 | $20,158 | $1,675,004 | $1,172,505 | $502,499 |
| 2022 | $20,158 | $1,642,162 | $1,149,515 | $492,647 |
| 2021 | $19,803 | $1,609,964 | $1,126,976 | $482,988 |
| 2020 | $19,939 | $1,593,457 | $1,115,421 | $478,036 |
| 2019 | $19,208 | $1,562,213 | $1,093,550 | $468,663 |
| 2018 | $18,563 | $1,531,582 | $1,072,108 | $459,474 |
| 2017 | $8,192 | $660,894 | $243,696 | $417,198 |
| 2016 | $8,045 | $647,938 | $238,919 | $409,019 |
| 2015 | $7,678 | $638,207 | $235,331 | $402,876 |
| 2014 | $7,479 | $625,707 | $230,722 | $394,985 |
Source: Public Records
Map
Nearby Homes
- 352 Arkansas St
- 1812 20th St
- 631 Carolina St
- 666 Carolina St Unit 666
- 561 Connecticut St
- 573 Connecticut St
- 700 De Haro St
- 264 Missouri St
- 448 Pennsylvania Ave
- 2023 22nd St
- 1002 Rhode Island St Unit 1
- 2119 22nd St
- 601 Pennsylvania Ave
- 451 Kansas St Unit 410
- 699 Pennsylvania Ave Unit 2
- 140 Pennsylvania Ave Unit 204
- 999 16th St Unit 11
- 701 Pennsylvania Ave Unit 109
- 701 Pennsylvania Ave Unit 107
- 2225 Mariposa St
- 1631 19th St
- 1625 19th St Unit 1627
- 1639 19th St
- 515 Wisconsin St Unit 517
- 1637 19th St
- 525 Wisconsin St Unit 527
- 410 Arkansas St Unit 412
- 420 Arkansas St
- 406 Arkansas St
- 539 Wisconsin St
- 537 Wisconsin St
- 426 Arkansas St Unit 3
- 426 Arkansas St Unit 2
- 426 Arkansas St Unit 1
- 432 Arkansas St Unit 432
- 430 Arkansas St Unit 432
- 545 Wisconsin St Unit 547
- 438 Arkansas St Unit 440
- 532 Wisconsin St
- 528 Wisconsin St