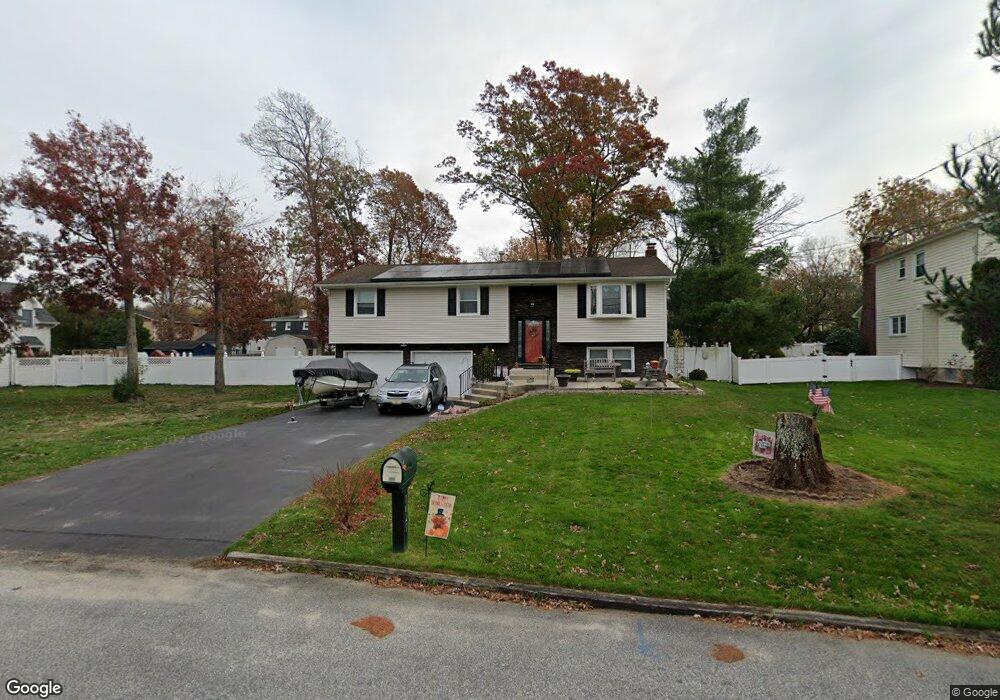
1629 Dolly Dr Vineland, NJ 08361
Estimated Value: $343,000 - $457,000
3
Beds
3
Baths
1,858
Sq Ft
$212/Sq Ft
Est. Value
About This Home
This home is located at 1629 Dolly Dr, Vineland, NJ 08361 and is currently estimated at $393,578, approximately $211 per square foot. 1629 Dolly Dr is a home located in Cumberland County with nearby schools including Pauline J. Petway Elementary School, Anthony Rossi Elementary School, and Vineland Senior High School.
Ownership History
Date
Name
Owned For
Owner Type
Purchase Details
Closed on
Sep 25, 2017
Sold by
Haefner-Rogers Janet and Rogers John P
Bought by
Rogers John P and Haefner-Rogers Janet
Current Estimated Value
Purchase Details
Closed on
Oct 25, 2012
Sold by
Rogers John P
Bought by
Rogers John P and Haefner Janet M
Home Financials for this Owner
Home Financials are based on the most recent Mortgage that was taken out on this home.
Original Mortgage
$169,100
Interest Rate
3.42%
Mortgage Type
Purchase Money Mortgage
Purchase Details
Closed on
Aug 21, 2009
Sold by
Mckee Ilene and Guidoni Samuel
Bought by
Rogers John P
Home Financials for this Owner
Home Financials are based on the most recent Mortgage that was taken out on this home.
Original Mortgage
$182,590
Interest Rate
5.17%
Mortgage Type
FHA
Purchase Details
Closed on
Oct 27, 2008
Sold by
Mckee Ilene
Bought by
Mckee I I and Mckee Guidoni S
Purchase Details
Closed on
Oct 1, 2008
Sold by
Mckee Ilene
Bought by
Mckee Ilene
Create a Home Valuation Report for This Property
The Home Valuation Report is an in-depth analysis detailing your home's value as well as a comparison with similar homes in the area
Home Values in the Area
Average Home Value in this Area
Purchase History
| Date | Buyer | Sale Price | Title Company |
|---|---|---|---|
| Rogers John P | -- | -- | |
| Rogers John P | -- | The Title Group Agency Inc | |
| Rogers John P | $186,000 | -- | |
| Mckee I I | -- | -- | |
| Mckee Ilene | -- | -- |
Source: Public Records
Mortgage History
| Date | Status | Borrower | Loan Amount |
|---|---|---|---|
| Previous Owner | Rogers John P | $169,100 | |
| Previous Owner | Rogers John P | $182,590 |
Source: Public Records
Tax History Compared to Growth
Tax History
| Year | Tax Paid | Tax Assessment Tax Assessment Total Assessment is a certain percentage of the fair market value that is determined by local assessors to be the total taxable value of land and additions on the property. | Land | Improvement |
|---|---|---|---|---|
| 2025 | $5,164 | $162,200 | $37,600 | $124,600 |
| 2024 | $5,164 | $162,200 | $37,600 | $124,600 |
| 2023 | $5,130 | $162,200 | $37,600 | $124,600 |
| 2022 | $4,978 | $162,200 | $37,600 | $124,600 |
| 2021 | $4,887 | $162,200 | $37,600 | $124,600 |
| 2020 | $4,748 | $162,200 | $37,600 | $124,600 |
| 2019 | $4,683 | $162,200 | $37,600 | $124,600 |
| 2018 | $4,559 | $162,200 | $37,600 | $124,600 |
| 2017 | $4,331 | $162,200 | $37,600 | $124,600 |
| 2016 | $4,178 | $162,200 | $37,600 | $124,600 |
| 2015 | $4,024 | $162,200 | $37,600 | $124,600 |
| 2014 | $3,805 | $162,200 | $37,600 | $124,600 |
Source: Public Records
Map
Nearby Homes
- 2564 Edna Dr
- 2551 Edna Dr
- 1730 Junior Dr
- 2354 Dante Ave
- 1535 Bear Branch Ct
- 1319 Paterson Dr
- 1880 S Brookfield St
- 1197 S Lincoln Ave
- 1154 Mcclain Dr
- 2769 Dante Ave
- 2151 S Brookfield St
- 2851 Crane St
- 3391 Venturi Ln
- 1248 Kirkwood Dr
- 1178 S Spring Rd
- 1601 S Spring Rd
- 1775 Roosevelt Blvd
- 1550 S Lincoln Ave
- 1037 Queens Rd
- 1731 Magnolia Rd