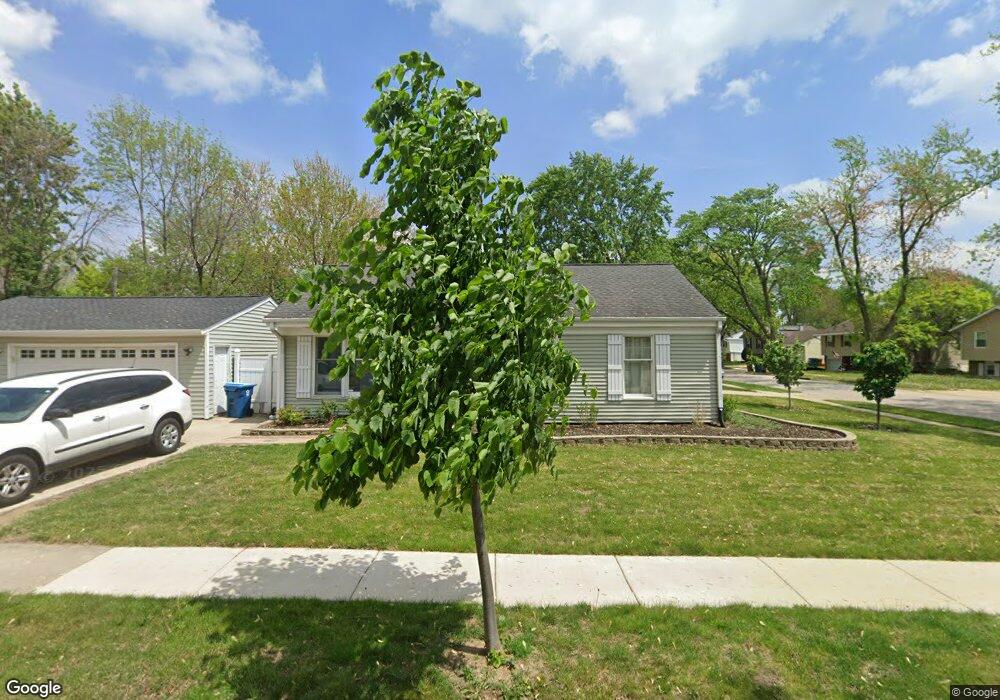
1629 Friedrich St Glendale Heights, IL 60139
Estimated Value: $316,000 - $356,000
3
Beds
1
Bath
1,107
Sq Ft
$305/Sq Ft
Est. Value
About This Home
This home is located at 1629 Friedrich St, Glendale Heights, IL 60139 and is currently estimated at $337,416, approximately $304 per square foot. 1629 Friedrich St is a home located in DuPage County with nearby schools including Americana Intermediate School, Glenside Middle School, and Glenbard North High School.
Ownership History
Date
Name
Owned For
Owner Type
Purchase Details
Closed on
Dec 11, 2019
Sold by
Fatima Nishat and Alam Daanish
Bought by
Adan Pablo
Current Estimated Value
Purchase Details
Closed on
Aug 15, 2011
Sold by
Secretary Of Housing & Urban Development
Bought by
Fatima Nishat
Purchase Details
Closed on
Aug 17, 2010
Sold by
Gonzalez Miguel A and Wells Fargo Bank Na
Bought by
Secretary Of Housing & Urban Development
Purchase Details
Closed on
Jan 31, 2001
Sold by
Fielding Rick T
Bought by
Gonzalez Miguel A and Kline Virginia B
Home Financials for this Owner
Home Financials are based on the most recent Mortgage that was taken out on this home.
Original Mortgage
$147,689
Interest Rate
6.91%
Mortgage Type
FHA
Create a Home Valuation Report for This Property
The Home Valuation Report is an in-depth analysis detailing your home's value as well as a comparison with similar homes in the area
Home Values in the Area
Average Home Value in this Area
Purchase History
| Date | Buyer | Sale Price | Title Company |
|---|---|---|---|
| Adan Pablo | $120,000 | First American Title | |
| Fatima Nishat | -- | Stewart Title Company | |
| Secretary Of Housing & Urban Development | -- | None Available | |
| Gonzalez Miguel A | $150,000 | First American Title Ins Co |
Source: Public Records
Mortgage History
| Date | Status | Borrower | Loan Amount |
|---|---|---|---|
| Previous Owner | Gonzalez Miguel A | $147,689 |
Source: Public Records
Tax History Compared to Growth
Tax History
| Year | Tax Paid | Tax Assessment Tax Assessment Total Assessment is a certain percentage of the fair market value that is determined by local assessors to be the total taxable value of land and additions on the property. | Land | Improvement |
|---|---|---|---|---|
| 2024 | $7,465 | $89,590 | $23,346 | $66,244 |
| 2023 | $7,198 | $81,930 | $21,350 | $60,580 |
| 2022 | $5,870 | $64,500 | $20,180 | $44,320 |
| 2021 | $5,545 | $61,280 | $19,170 | $42,110 |
| 2020 | $5,333 | $59,780 | $18,700 | $41,080 |
| 2019 | $5,157 | $57,450 | $17,970 | $39,480 |
| 2018 | $5,906 | $58,510 | $17,500 | $41,010 |
| 2017 | $5,721 | $54,230 | $16,220 | $38,010 |
| 2016 | $5,492 | $50,190 | $15,010 | $35,180 |
| 2015 | $5,382 | $46,840 | $14,010 | $32,830 |
| 2014 | $5,388 | $46,530 | $13,700 | $32,830 |
| 2013 | $5,322 | $48,120 | $14,170 | $33,950 |
Source: Public Records
Map
Nearby Homes
- 134 W Montana Ave
- 1713 Schmale Rd
- 56 N Golfview Ct
- 1500 Golfview Ct Unit 5
- 10 W Nevada Ave
- 108 Golfview Dr
- 1890 Harvest Ln
- 1760 Lombard Ct
- 203 Ahmed Ct
- 200 Ahmed Ct
- 118 Windsor Ln
- 251 Polo Club Dr
- 67 Stonefield Dr
- 179 Glen Hill Dr
- 2N643 Diane Ave
- 112 Arbor Dr
- 784 N Gary Ave Unit 212
- 726 N Gary Ave Unit 109A
- 23W285 Armitage Ave
- 437 Eagle View Dr
- 168 W Montana Ave
- 164 W Montana Ave
- 1639 Friedrich St
- 1626 Friedrich St
- 1630 Friedrich St
- 169 W Altgeld Ave
- 1619 Friedrich St Unit 2
- 165 W Altgeld Ave
- 169 W Montana Ave
- 1622 Friedrich St
- 160 W Montana Ave
- 1636 Friedrich St
- 165 W Montana Ave
- 161 W Altgeld Ave
- 1616 Friedrich St
- 156 W Montana Ave
- 161 W Montana Ave
- 157 W Altgeld Ave
- 1612 Friedrich St
- 1649 Friedrich St